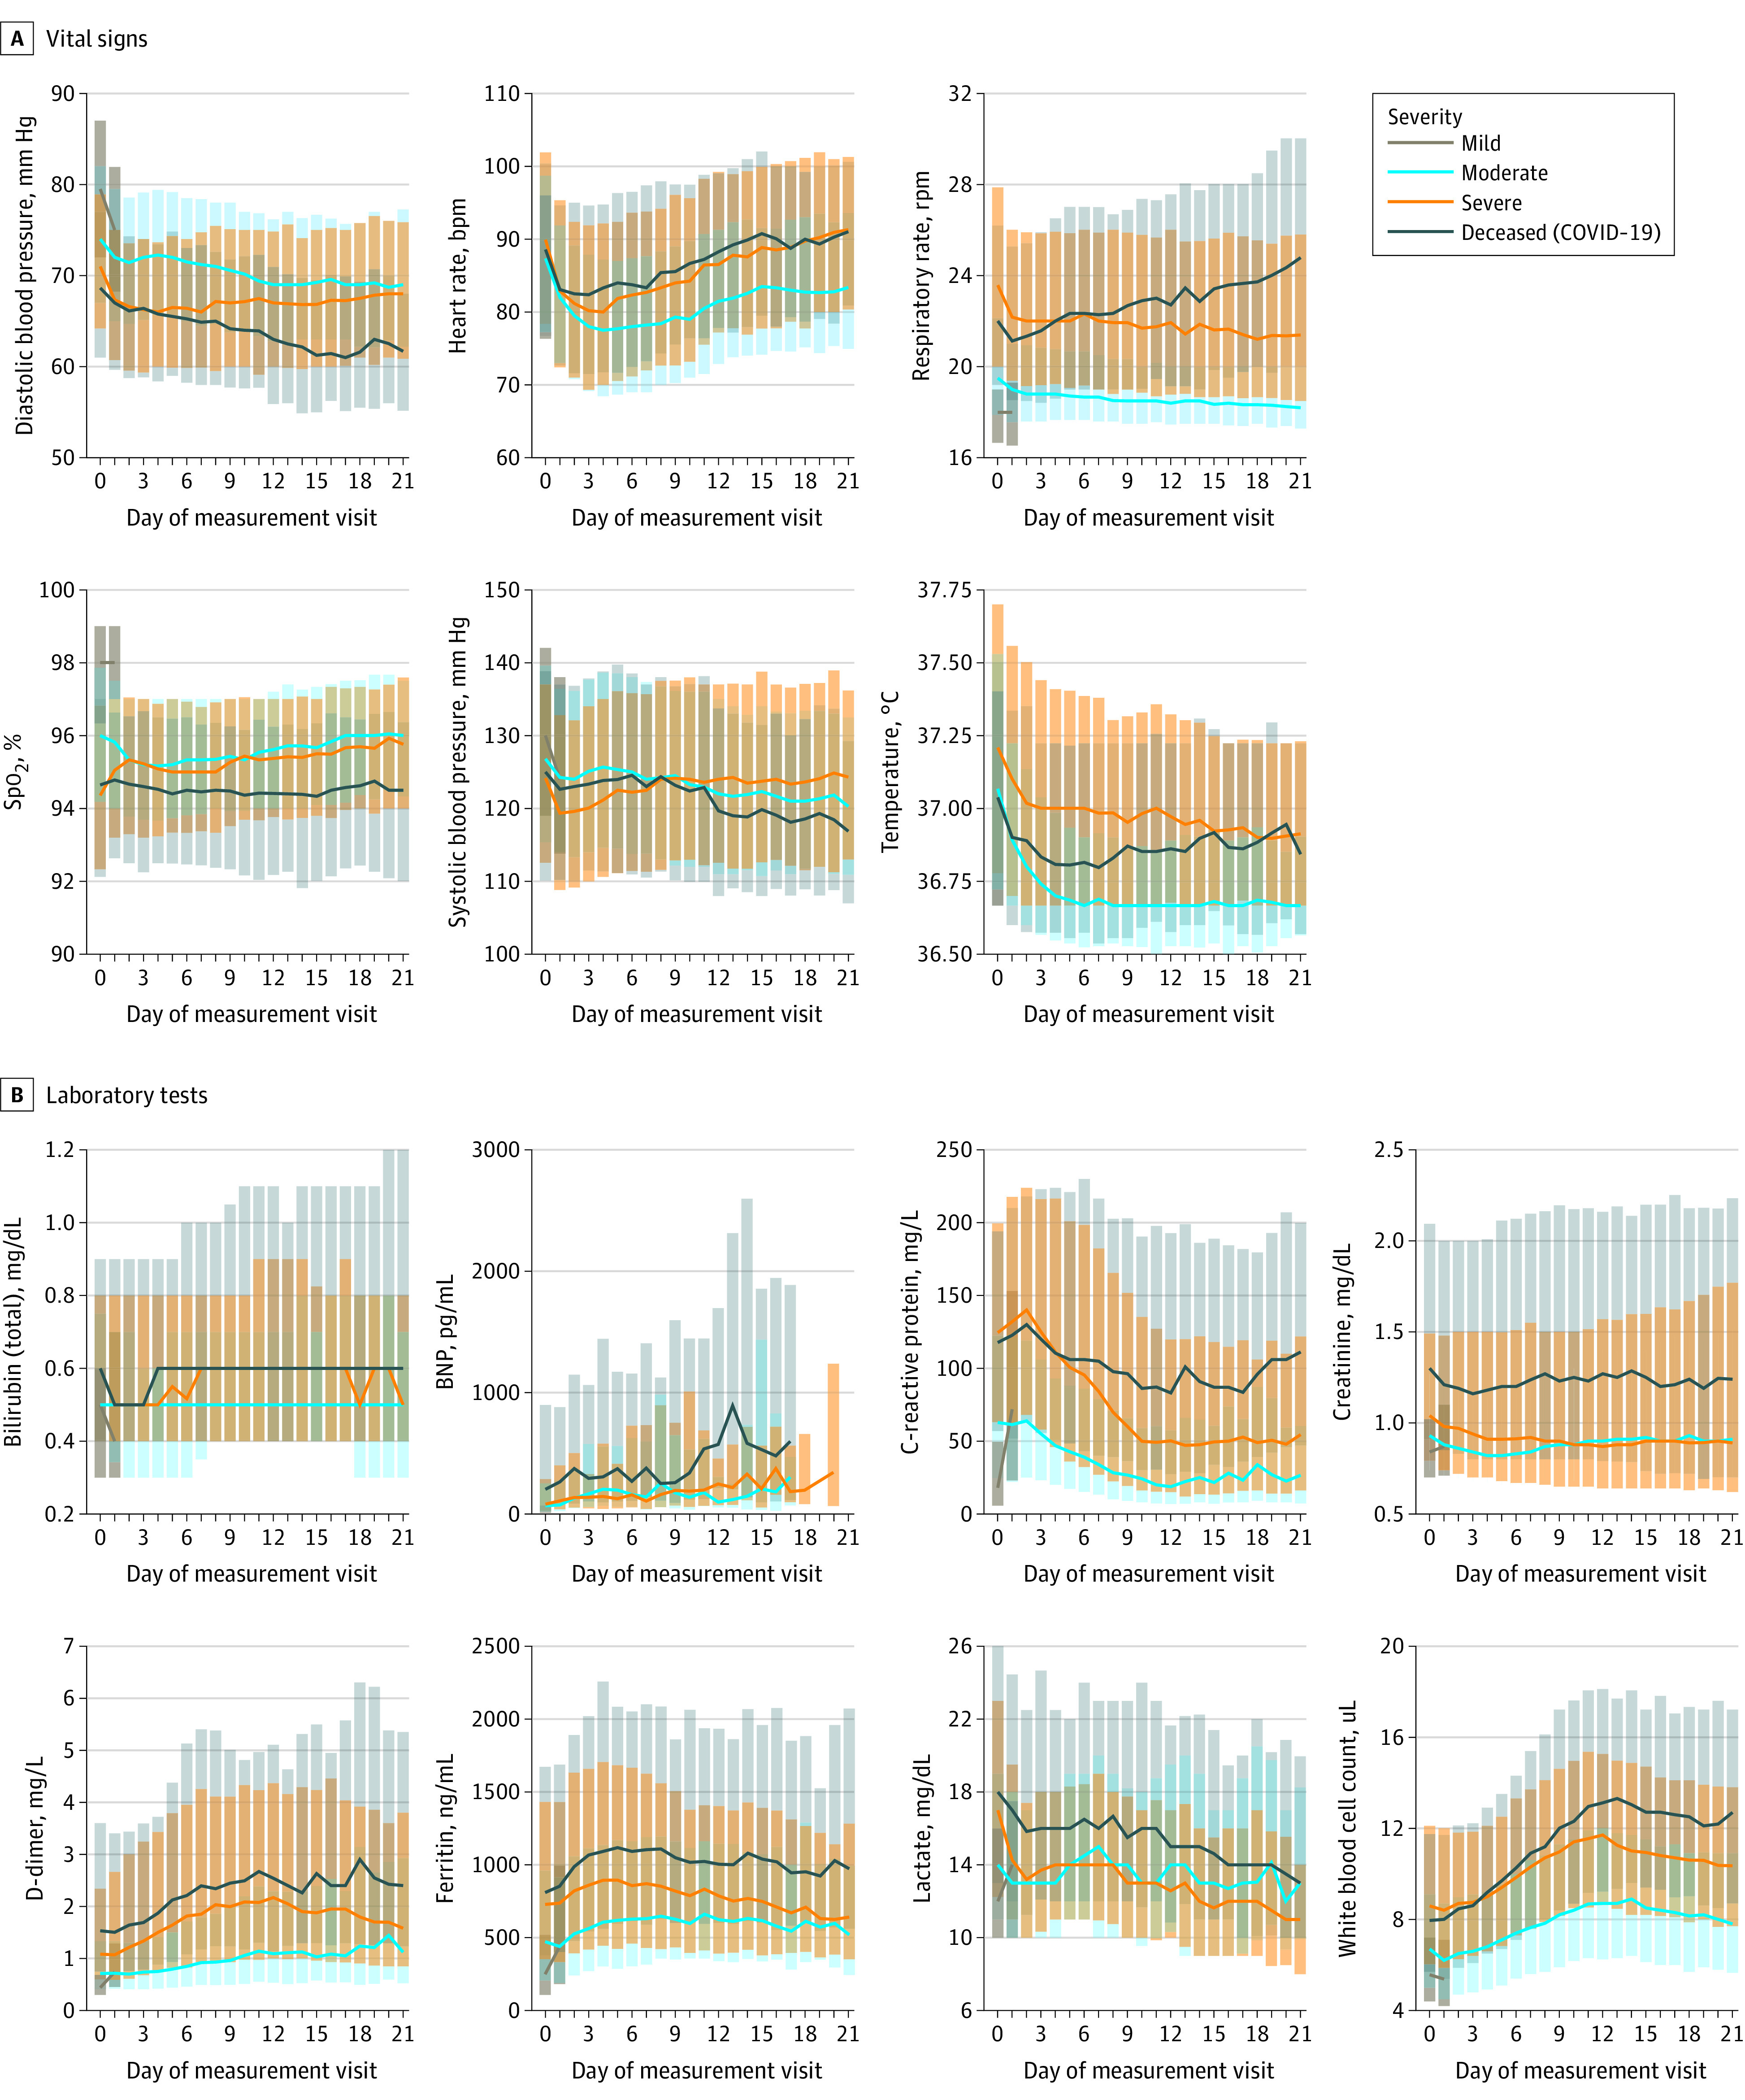
Figure 4. Trajectories of Vital Signs and Laboratory Tests During a Hospital Encounter.

A, Medians (line) and interquartile ranges (error bars) of each vital sign on each hospital day, stratified by patient maximum severity (Table). B, Medians (line) and interquartile ranges (error bars) of each laboratory test on each hospital day, stratified by the same severity groups. We tested trajectory differences between severity groups using 1-way analysis of variance at day 7. BNP indicates brain-type natriuretic peptide; Spo2, saturation as measured by pulse oximetry.
SI conversion factors: To convert bilirubin to micromoles per liter, multiply by 17.104; BNP to nanograms per liter, multiply by 1; C-reactive protein to milligrams per liter, multiply by 10; creatinine to micromoles per liter, multiply by 88.4; D-dimer to nanomoles per liter, multiply by 5.476; ferritin to micrograms per liter, multiply by 1; lactate to millimoles per liter, multiply by 0.111; and white blood cells to ×109/L, multiply by 0.001.
