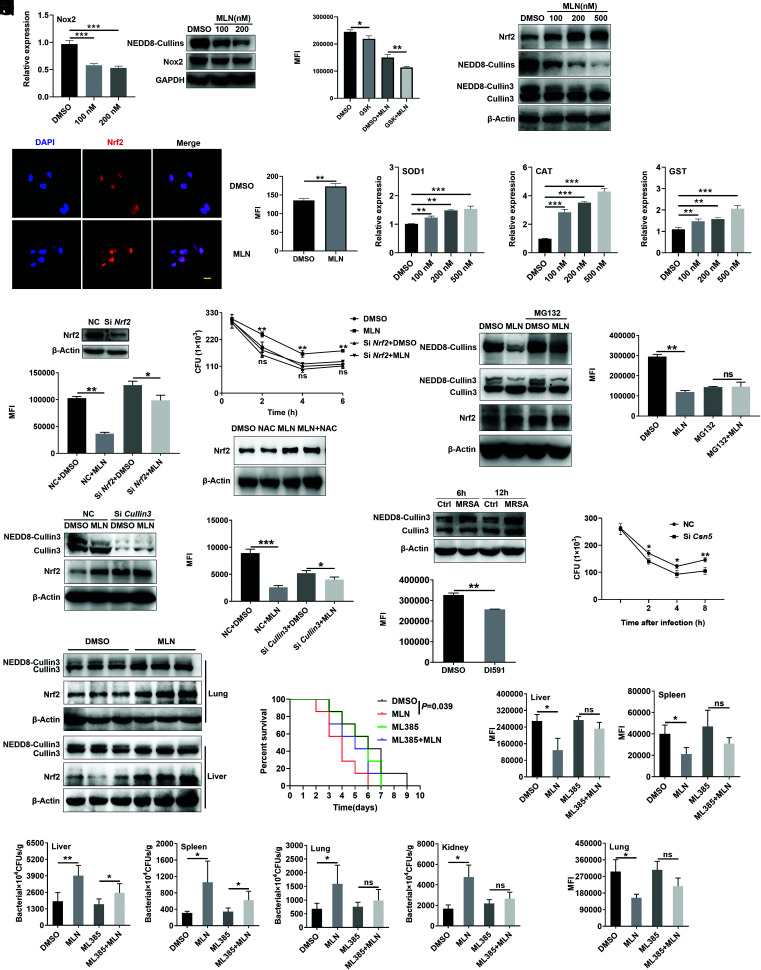
FIGURE 6.
MLN4924 decreases ROS partly via the NEDD8-Cullin3-Nrf2 pathway. (A) PMs were treated with 100 and 200 nM MLN4924 for 6 h, followed by USA300 infection at an MOI of 20 for an additional 6 h. The Nox2 level was analyzed by real-time PCR (right) and Western blotting (left). (B) PMs were pretreated with or without GSK2795039 (GSK, a Nox2 inhibitor) for 12 h, treated with or without 100 nM MLN4924 for 6 h, and stimulated with USA300 infection at an MOI of 20 for another 6 h. ROS in these cells were statistically analyzed by flow cytometry. (C–E) PMs were treated with 100, 200, and 500 nM MLN4924 for 6 h, followed by USA300 infection at an MOI of 20 for an additional 6 h. Nrf2, NEDD8-Cullins, and Cullin3 in these cells were detected by immunoblotting (C). The distribution of Nrf2 in PMs treated with 100 nM MLN4924 for 12 h was assessed by immunofluorescence (left) and statistical analysis (right) (D). Scale bar, 10 μm. Sod1, Cat and Gst mRNA levels were analyzed by real-time PCR (E). (F and G) PMs were transfected with NC or Nrf2 siRNA for 48 h, followed by treatment with 100 nM MLN4924 for 6 h. Then, the cells were infected with USA300 at an MOI of 20 for an additional 6 h. The Nrf2 levels were analyzed by Western blotting (top), and ROS in these cells were statistically analyzed by flow cytometry (bottom) (F). CFUs were quantified at the indicated time points after USA300 infection (G). (H) PMs pretreated with or without 5 mM NAC for 0.5 h, followed by 100 nM MLN4924 treatment for 6 h. Then, the cells were infected with USA300 at an MOI of 20 for 6 h. Nrf2 in PMs was detected by immunoblotting. (I and J) PMs were treated with MG132 (10 μM) for 2 h, followed by MLN4924 (100 nM) treatment for an additional 6 h. Then, the cells were incubated with USA300 at an MOI of 20 for an additional 6 h. The protein levels of NEDD8-Cullins, Nrf2, and Cullin3 were analyzed by Western blotting (I). ROS were analyzed by flow cytometry and statistically analyzed in (J). (K and L) PMs were transfected with NC or Cullin3 siRNA for 48 h, followed by 100 nM MLN4924 treatment for 6 h and infection with USA300 at an MOI of 20 for an additional 6 h. The Cullin3 and Nrf2 protein levels were analyzed by Western blot analysis (K). ROS in these cells were analyzed by flow cytometry and statistically analyzed in (L). (M) PMs were infected with USA300 at an MOI of 20 for 6 and 12 h. Then, the Cullin3 and NEDD8-Cullin3 proteins were observed by Western blotting. (N) After DI591 treatment for 12 h and infection with USA300 at an MOI of 20 for 6 h, the ROS in PMs were analyzed by flow cytometry. (O) PMs were transfected with NC or Csn5 siRNA for 48 h, followed by infection with USA300 at an MOI of 20 for 30 min, and CFUs were quantified at the indicated time points after USA300 infection. (P) Mice were i.p. injected with 30 mg/kg MLN4924 or an equal volume of DMSO. Twelve hours later, the mice were infected with USA300 (1 × 10⁸ CFUs) via tail vein. CD11b+F4/80+ macrophages were sorted by flow cytometry 12 h after USA300 administration, and Cullin3 and Nrf2 protein levels were analyzed by Western blotting. (Q–S) Mice were i.p. injected with 30 mg/kg MLN4924 with or without 10 mg/kg ML385, and 12 h later, the mice were infected with USA300 via tail vein injection. The survival rate was recorded (n = 7) (Q), and ROS of macrophages in liver, lungs, spleen (n = 3) (R) and the bacterial loads in the liver, lungs, spleen, and kidneys were measured (n = 5) (S). Data are representative of three independent experiments with similar results. ns, not significant. *p < 0.05, **p < 0.01, ***p < 0.001 (unpaired Student t test).

