FIGURE 3.

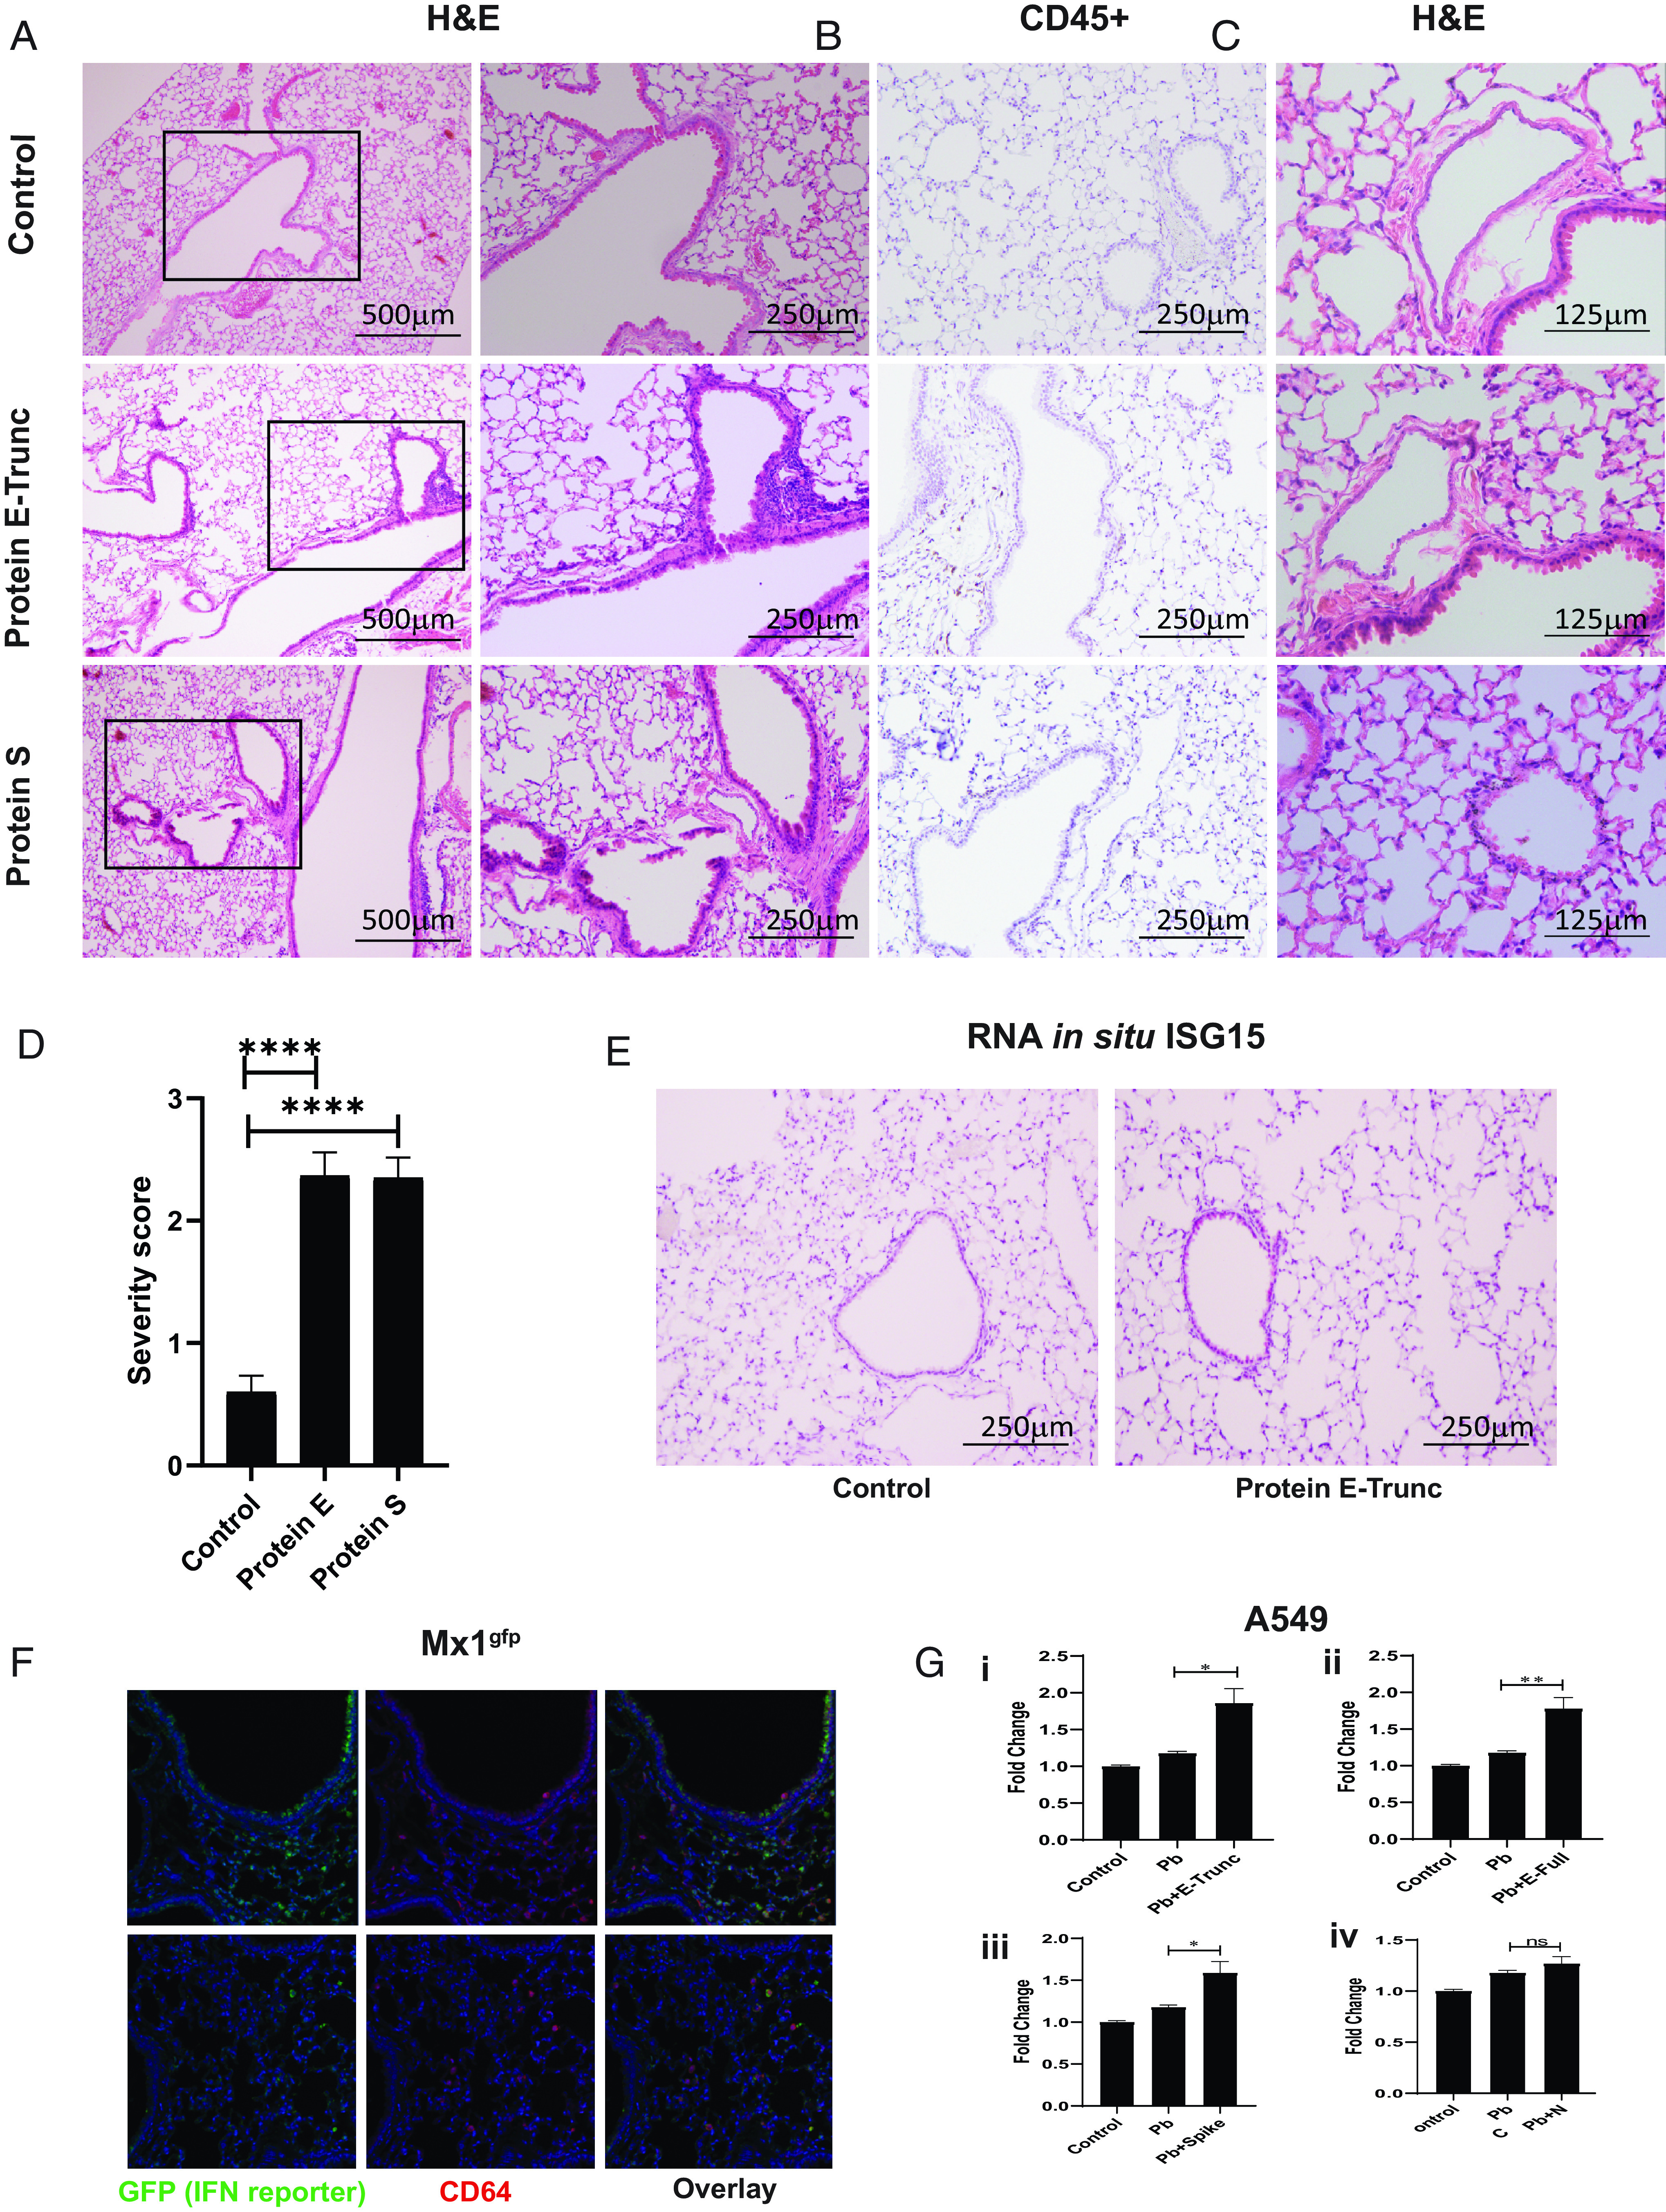
SARS-CoV-2 viral Ags induce lung inflammation and vasculitis in mice. (A) Representative images of lung cross-sections from mice sacrificed 3 d after intranasal delivery of control, E-Trunc, or S at 10 µg. H&E-stained sections are shown. Boxed areas on the left are magnified adjacently. (B) Representative images of the lung cross-sections immunostained for CD45 expression. (C) Representative images of lung cross-sections depicting blood vessel pathology in each condition. Scale bars depicted in each picture. (D) Quantification of percentage of lobes with inflammatory infiltrates in lungs harvested in each condition (n = 3 mice per condition). (E) Representative images of the lung cross-sections stained for Isg15 by RNA in situ (n = 3 mice per condition). (F) Representative immunofluorescent images of the lung cross-sections immunostained for GFP and CD64 expression per above conditions; original magnification ×200 (n = 2 mice per condition). (G) Fold change in IFN reporter activity in A549 cells treated with control, Pb at 10 µg/ml, or SARS-CoV-2 Ags [2 µg/ml E-Trunc (i), E-Full (ii), S (iii), or N (iv)] and Pb at 10 µg/ml for 24 h (n = 2 experiments: 6 biological and 9–21 technical replicates for each viral Ag). Graphs depict average with SEM. One-way ANOVA in (D) and Mann–Whitney U test in (G) used for statistical analysis. *p < 0.05, **p < 0.01, ****p < 0.0001. ns, not statistically significant.
