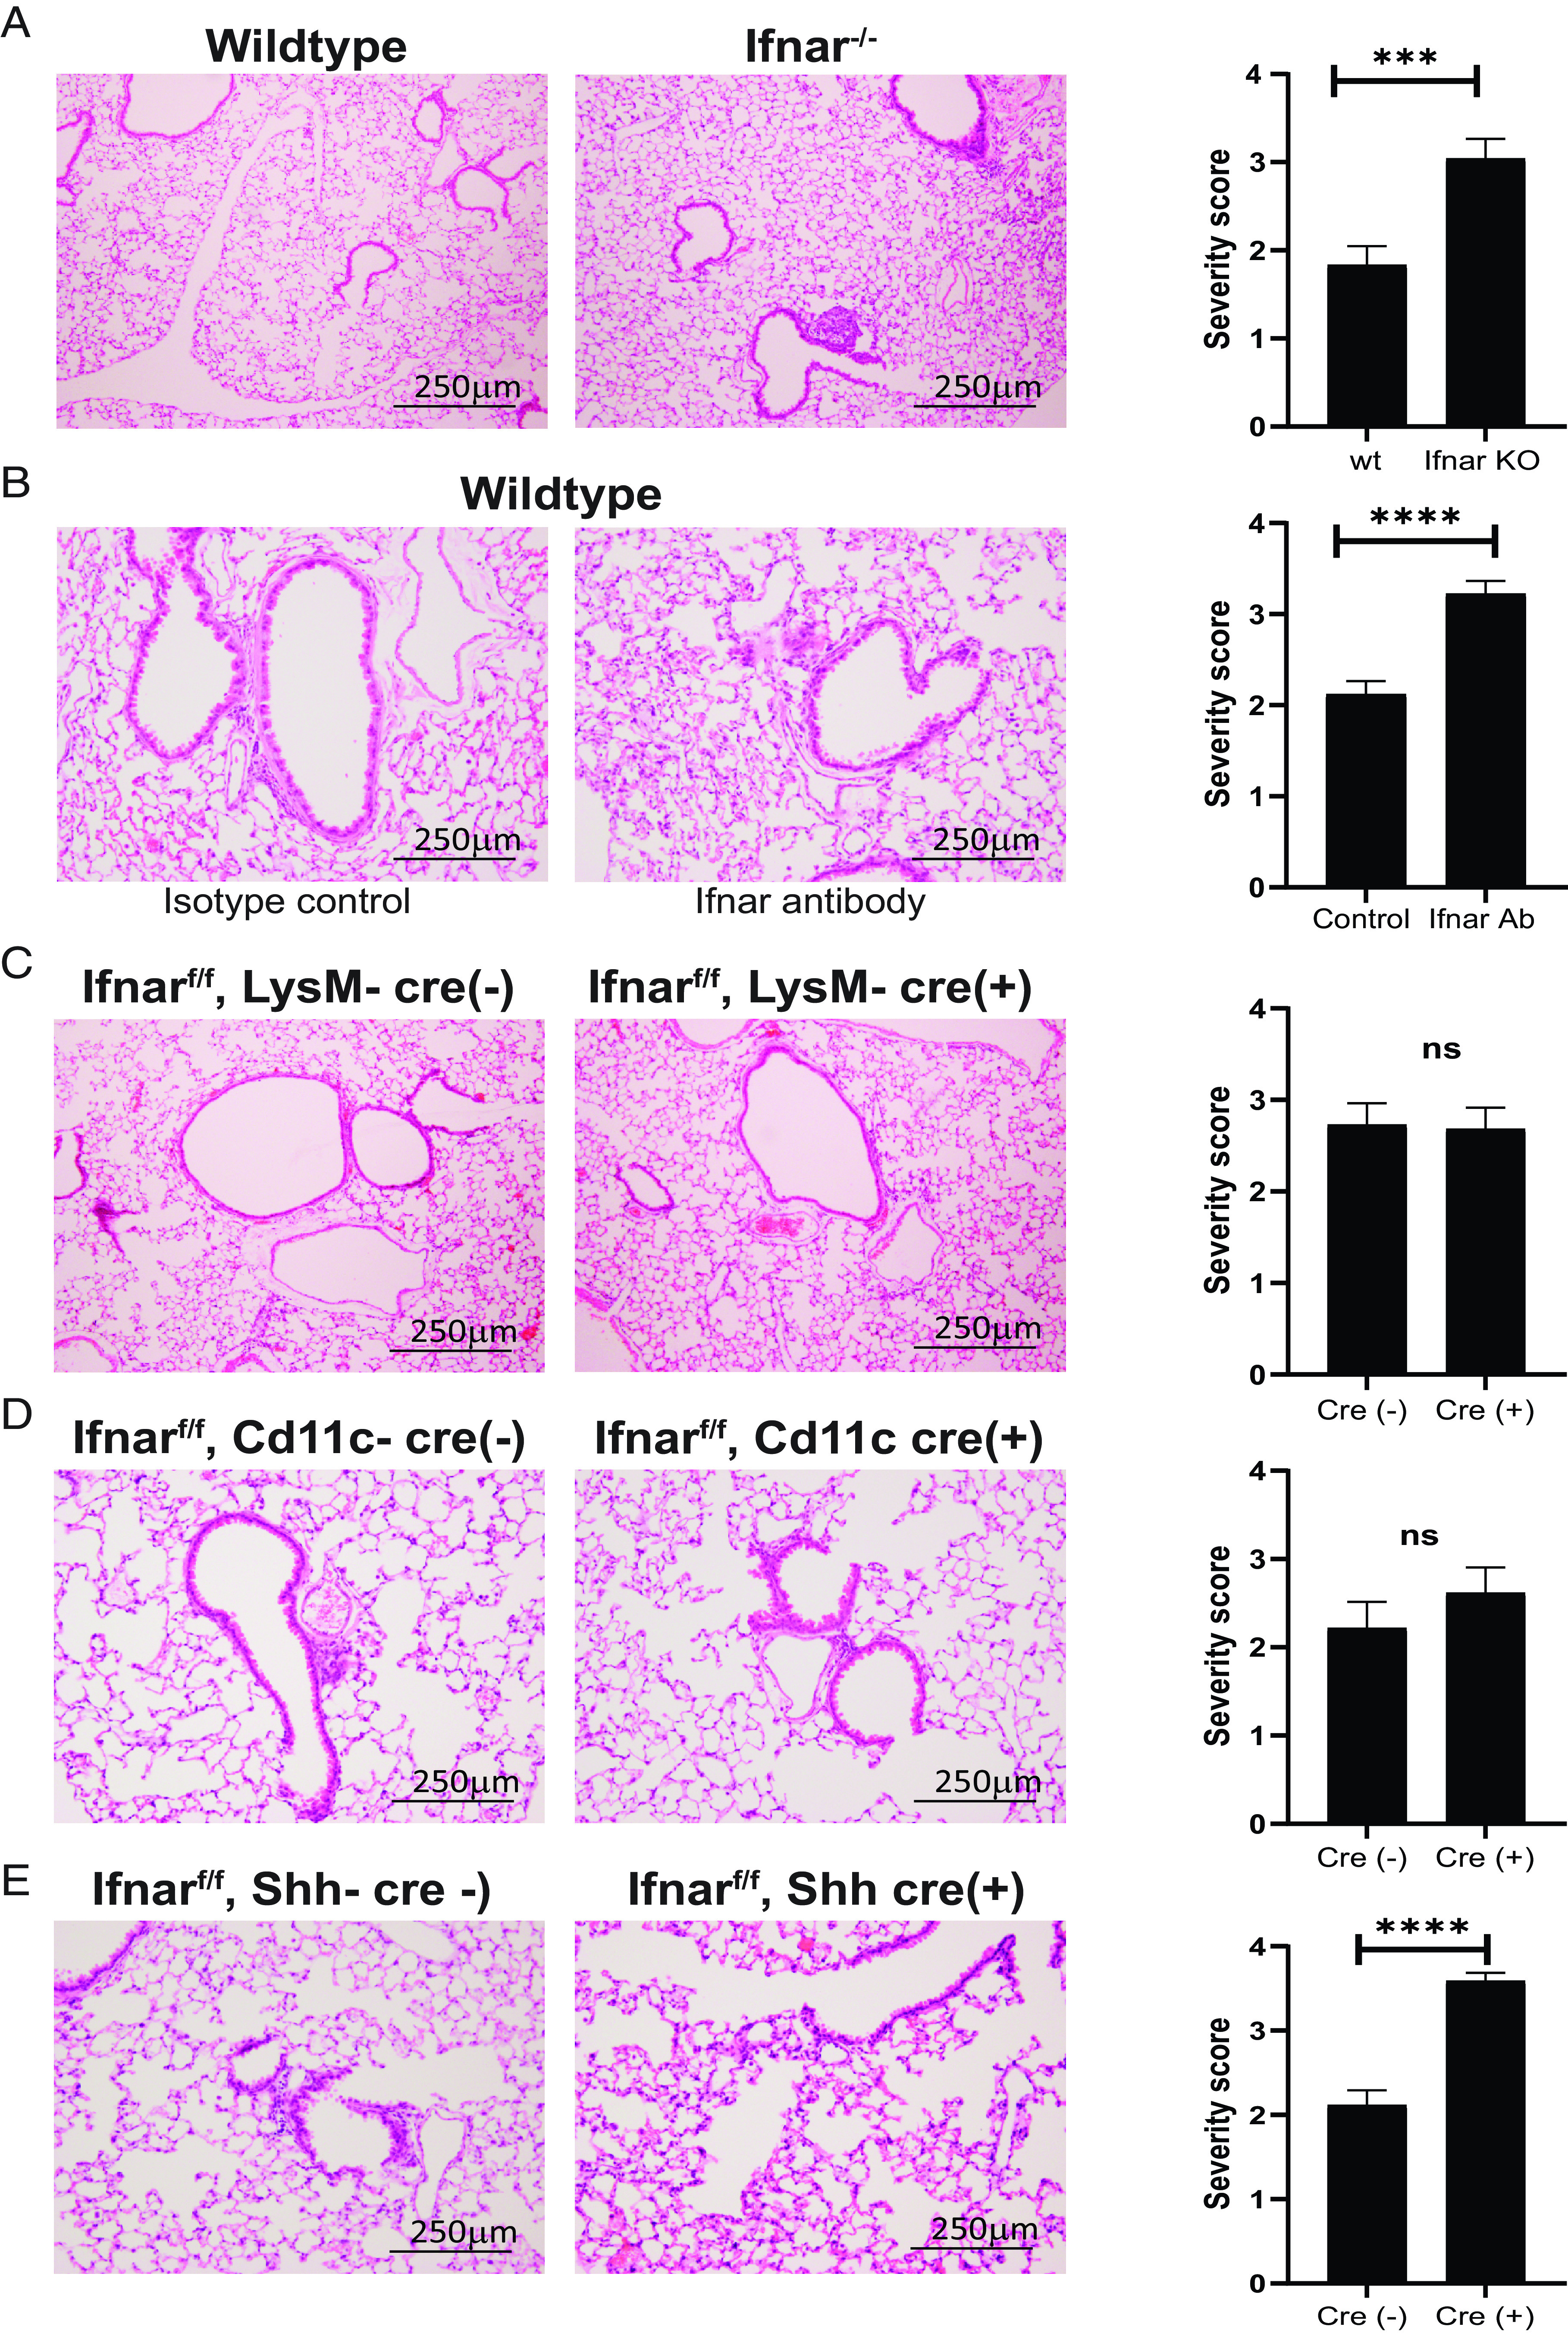
FIGURE 4.

SARS-CoV-2 viral Ag E induces airway epithelial IFN-dependent inflammation. (A) Representative images of lung cross-sections from Ifnar−/− mice sacrificed 3 d after intranasal delivery of control or E-Trunc at 10 µg. H&E-stained sections are shown (n = 3 with 4–5 mice per condition). (B) Representative images of lung cross-sections from wt mice sacrificed 3 d after intranasal delivery of E-Trunc at 10 µg subsequent to Ifnar-depleting or isotype control Ab administration. H&E-stained sections are shown (n = 2 with 6 mice per condition). (C) Representative images of lung cross-sections from Ifnarf/f;LysM-Cre(+/–) mice sacrificed 3 d after intranasal delivery of control or E-Trunc at 10 µg. H&E-stained sections are shown (n = 3 mice per condition). (D) Representative images of lung cross-sections from Ifnarf/f;Cd11c-Cre(+/–) mice sacrificed 3 d after intranasal delivery of control or E-Trunc at 10 µg. H&E-stained sections are shown (n = 2 mice per condition). (E) Representative images of lung cross-sections from Ifnarf/f;Shh-Cre(+/–) mice sacrificed 3 d after intranasal delivery of control or E-Trunc at 10 µg. H&E-stained sections are shown (n = 3 with 8–9 mice per condition). Scale bars depicted in each picture. Severity scores per lobe are quantified to the right of each experimental condition in (A)–(E). Graphs depict average with SEM. ***p < 0.001, ****p < 0.0001, by Mann–Whitney U test. ns, not statistically significant.
