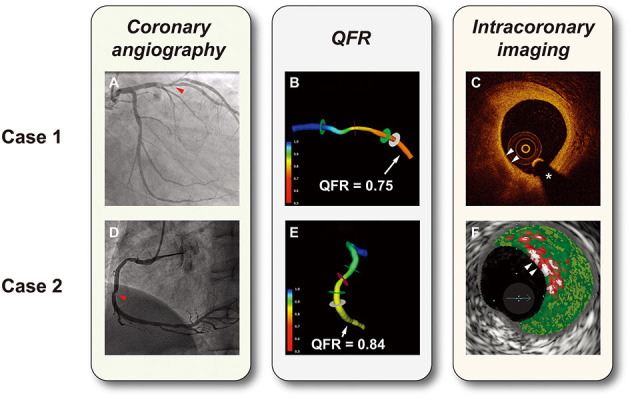
Figure 1.

Representative cases of hemodynamic and intravascular evaluations. (A) Coronary angiography showed a lesion with 50% diameter stenosis in the left anterior descending artery (the red arrow). (B) 3D vessel reconstruction with a QFR of 0.75. (C) OCT-TCFA: a lipid-rich plaque with the thinnest fibrous cap <65 μm (white arrows). (D) Coronary angiography showed a lesion with 50% diameter stenosis in the right coronary artery (the red arrow). (E) 3D vessel reconstruction with a QFR of 0.84. (F) VH-caTCFA (white arrows): necrotic core is coded as red, dense calcium as white, fibrous tissue as dark green, and fibrofatty tissue as light green. *guidewire artifact. QFR, quantitative flow ratio; OCT-TCFA, optical coherence tomography-thin cap fibroatheroma; VH-caTCFA, virtual histology-calcified thin cap fibroatheroma.
