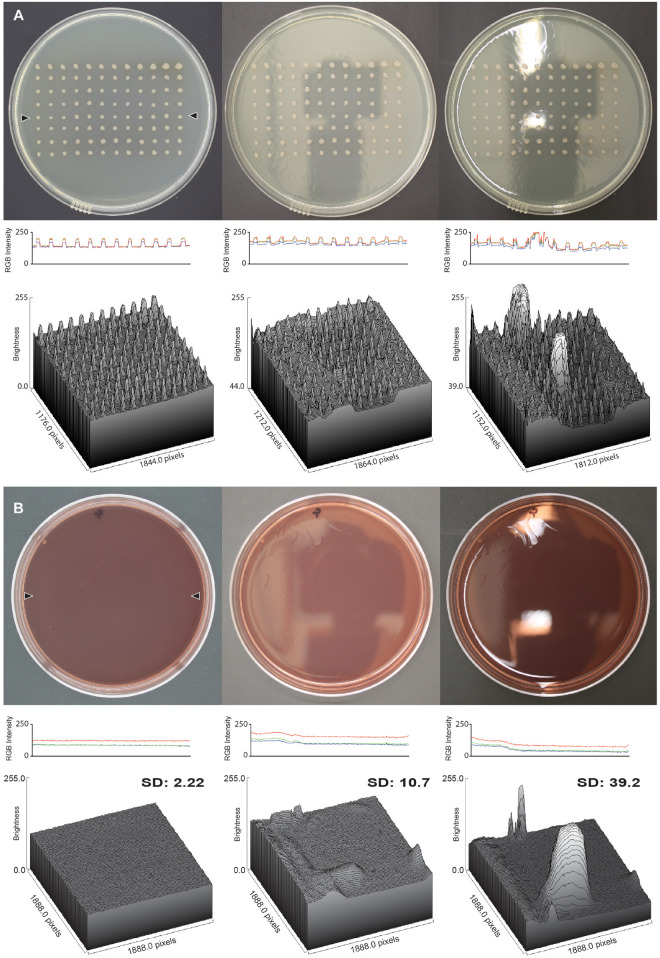
FIGURE 2.
Glare reduction in images captured with the imaging box. (A) Analysis of an LB replica plate with colonies of P. aeruginosa, and (B) an empty MacConkey agar plate, in both cases imaged in the imaging box (left column), without the imaging box but in an optimized location (center column), and without the imaging box on the lab bench (right column). The middle row shows the RGB profile plot of the images in the top row. The plot measures the RGB intensity of a line of pixels drawn across the plates between the locations marked by the two black triangles in the image captured with the imaging box. The line for the RGB profile plot was drawn in the same spot on all three plates, and the analysis was carried out in ImageJ. The bottom row shows the three-dimensional surface plot of pixel brightness of a grayscale image from a rectangular area that captured as much surface area on the plate as possible without including the edge of the plate. The standard deviation of the brightness is shown for each surface plot.

