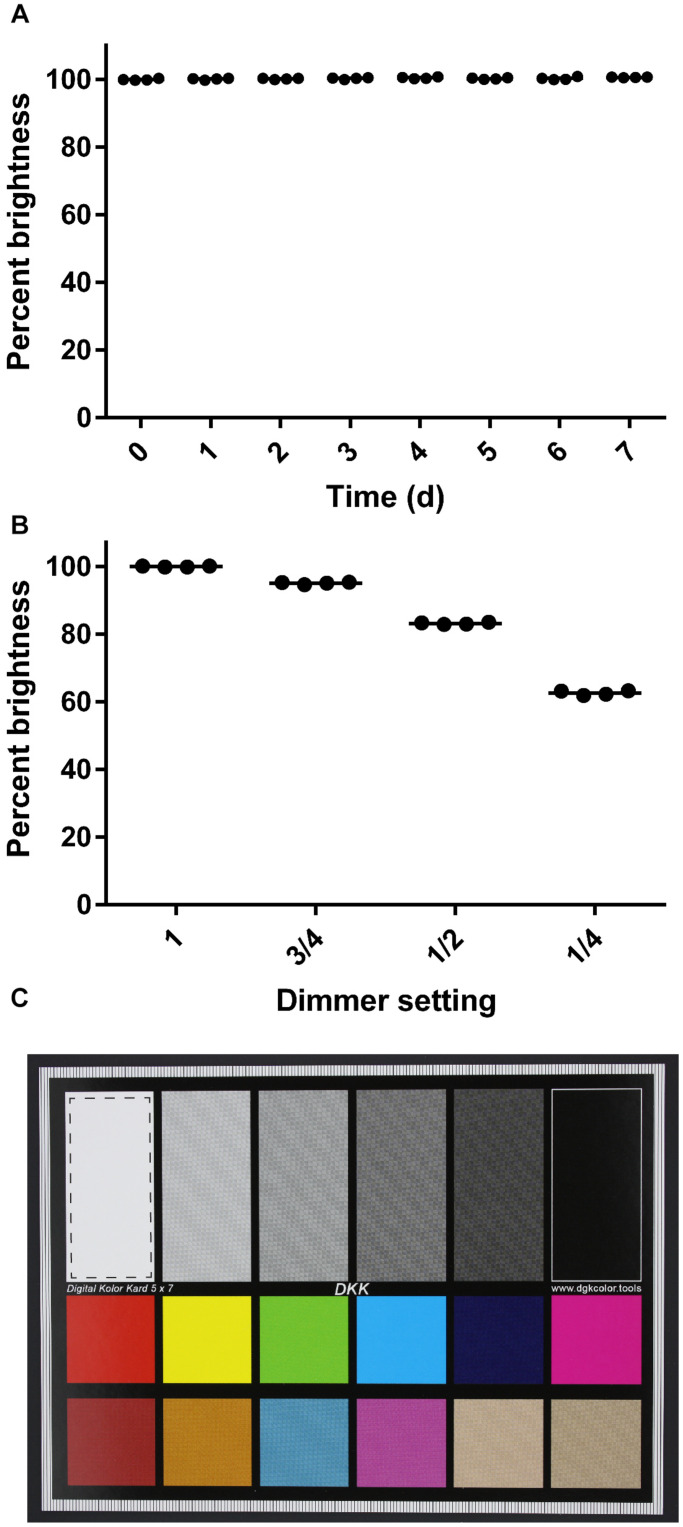
FIGURE 3.
Consistency of images captured with the imaging box. (A) Percent brightness of an image standard over a 7-day time course. The dimmer was removed from the apparatus for this series. Dots represent individual replicates (n = 4), and the bars represent means. The first time point is set to 100% brightness. (B) Percent brightness of an image standard captured at different dimmer settings. Dots represent individual replicates (n = 4), and the bars represent means. The brightness value obtained at the maximum dimmer setting is scaled to 100%. (C) Image standard used. The dashed line box in the white rectangle shows the area that was analyzed for mean brightness values in ImageJ.

