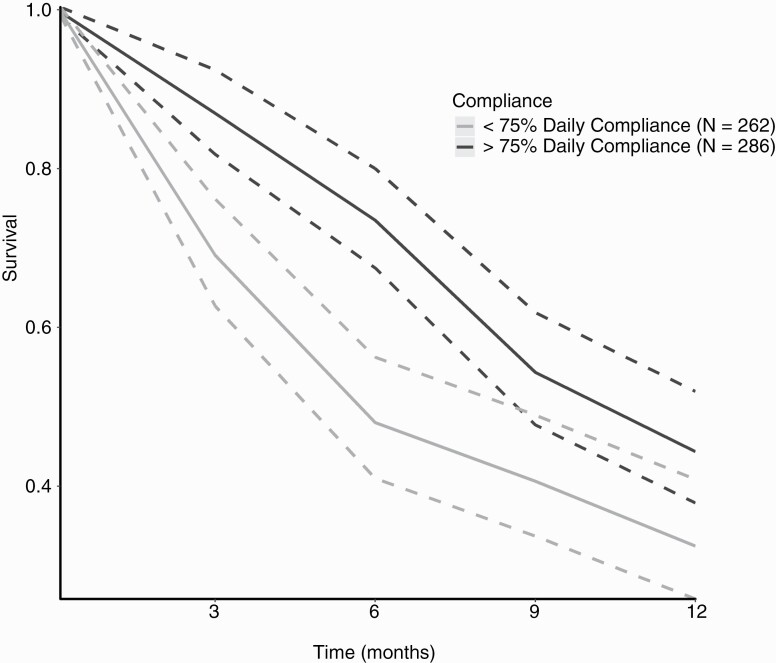
Figure 3.
Pooled Kaplan-Meier (KM) survival curves of OS according to daily compliance for rGBM patients. Pooled KM survival curves of OS for rGBM patients. The dark gray lines represent the pooled survival curve (solid line) with the 95%CI (dashed lines) of patients who used TTFields for ≥75% of the day (>18 h/d). The bright gray lines represent the pooled survival curve (solid line) with the 95%CI (dashed lines) of patients who used TTFields <75% of the day (<18 h/d). Abbreviations: OS, overall survival; rGBM, recurrent GBM; TTFields, Tumor-Treating Fields.

