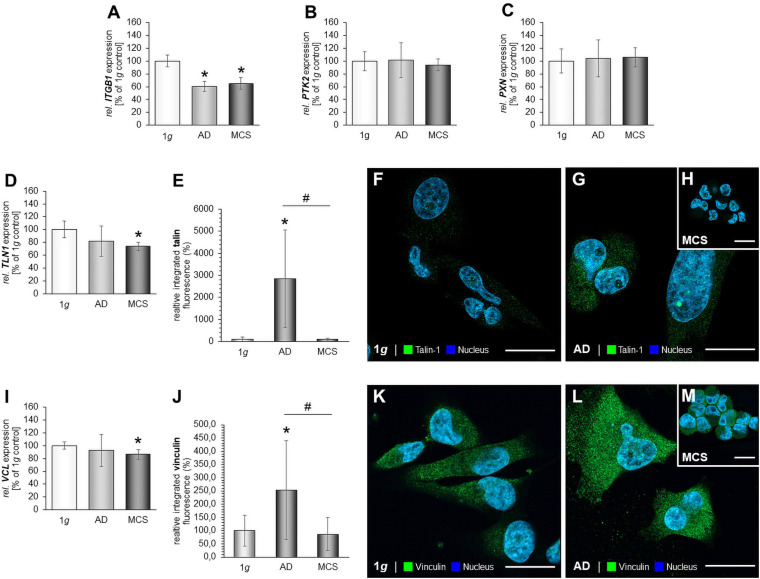
FIGURE 4.
Focal adhesions in MDA-MB-231 cells. The gene expression of ITGB1 (A), PTK2 mRNA expression (B), PXN mRNA expression (C) of MDA-MB-231 cells exposed to the RPM. In addition, the gene expression of TLN1 (D) and analysis of the fluorescence intensity of talin (E), IFS of 1g control cells (F) and RPM-exposed MDA-MB-231 cells [AD cells: (G) and MCS: (H)] is given. Moreover, the VCL mRNA (I) and analysis of the fluorescence intensity of vinculin (J), the IFS of vinculin are shown in 1g control cells (K) and RPM-exposed AD cells (L) and MCS (M). *p < 0.05 1g vs. AD and/or MCS and #p < 0.05 AD vs. MCS.

