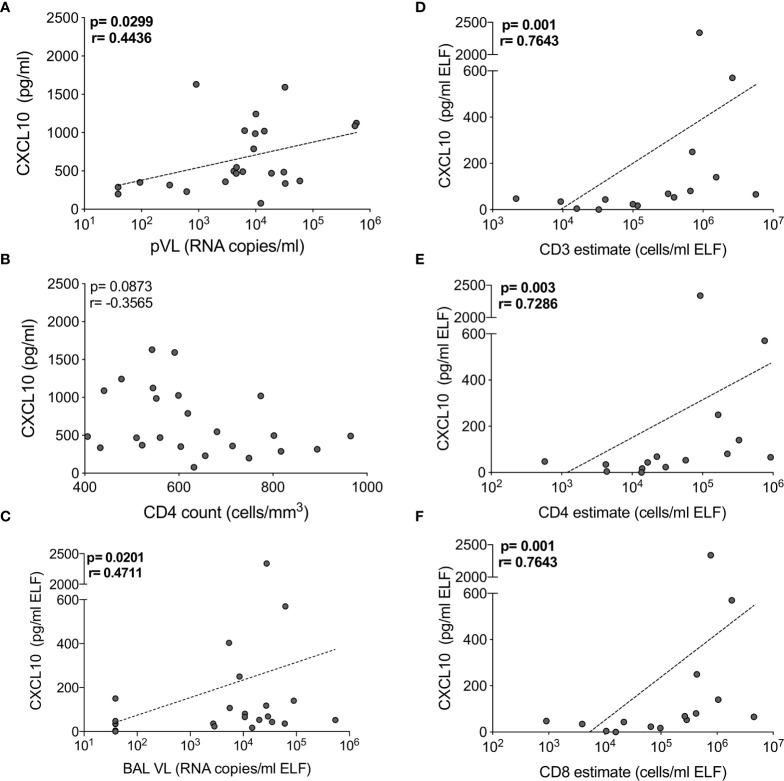
Figure 4.
CXCL10 correlates with HIV viral load and T cell numbers in BAL of HIV-infected individuals. The correlation between CXCL10 concentration and (A) plasma HIV viral load, (B) blood CD4 count in blood, (C) BAL HIV viral load (n=24), (D) BAL CD3, (E) CD4 and (F) CD8 T cell estimates (n=16). Each dot represents an individual. Only individuals with absolute BAL cell count data were plotted. The dotted line indicates linear regression for statistically significant correlations. Statistical analyses were performed using a non-parametric Spearman rank correlation.

