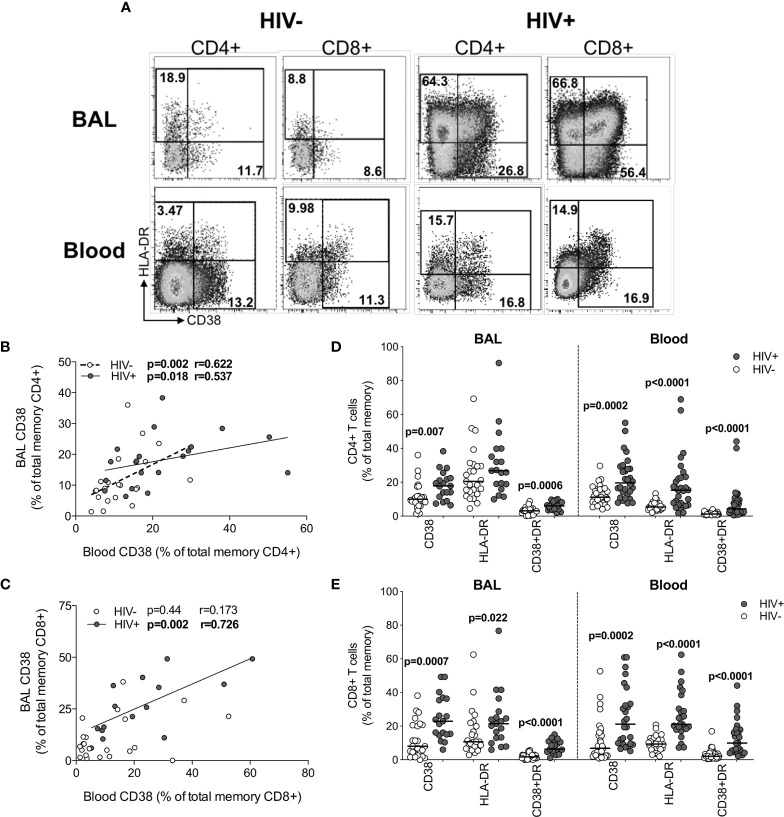
Figure 5.
T cell activation in BAL and blood. (A) Representative flow cytometry plots of HLA-DR and CD38 expression on T cells in BAL and blood of HIV-infected and uninfected participants. (B) The association between CD4+ T cells expressing CD38 in blood and BAL of HIV-uninfected (n=22) and infected (n=15) individuals. (C) The association between CD8+ T cells expressing CD38 in blood and BAL of HIV-uninfected (n=22) and infected (n=15) individuals. (D) CD38 and HLA-DR expression on CD4+ T cells in blood and BAL of HIV-uninfected (n=31 and n=25, respectively) and infected (n=30 and n=19, respectively) individuals. (E) CD38 and HLA-DR expression on CD8+ T cells in blood and BAL of HIV-uninfected and infected individuals. Each dot represents an individual. Open circles represent HIV-uninfected individuals and filled circles represent HIV-infected individuals. Statistical comparisons were performed using the non-parametric Mann Whitney, Wilcoxon matched pairs and Spearman correlation tests.

