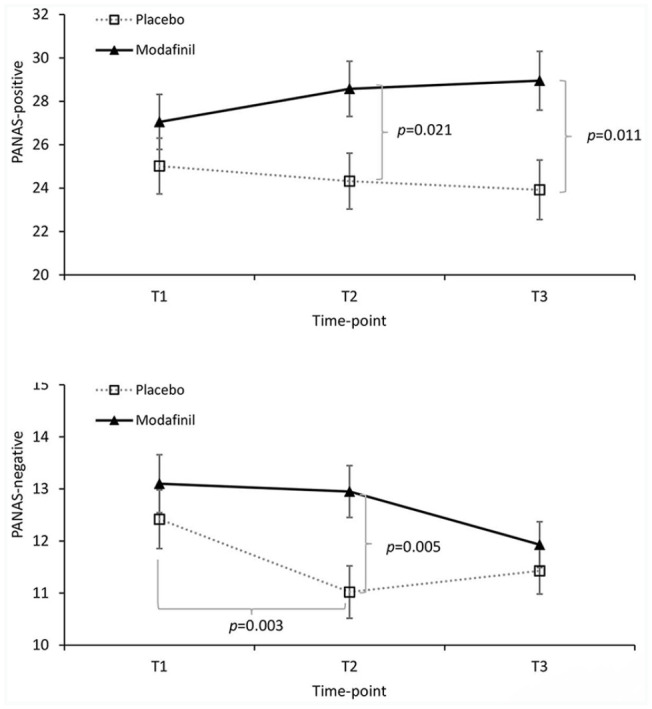
Figure 3.

Drug × time effects for (a) positive affect (mean Positive and Negative Affect Schedule (PANAS)-positive affect scores ± SE) and (b) negative affect (untransformed mean PANAS-negative ± SE are presented but analyses were performed on log transformed data because of skewness; see Supplemental material). T1, pre-drug; T2, post-drug (pre-strategy); T3, post-strategy. Significant pairwise comparisons are indicated with Bonferroni corrected p values.
