Figure 3.
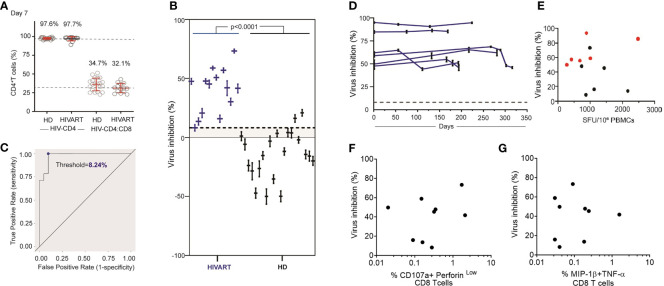
HIVART participants produce higher % inhibition of HIV than healthy donors. (A) %CD4 T cells at Day 7 in HIV-CD4 and HIV-CD4:CD8 T cell culture in HD and HIVART participants. Mean and SD shown in red. (B) Individual estimates for % inhibition [Equation (1)] and corresponding 95% CI [Equation (6)] in HD and HIVART participants. Difference in % inhibition between the groups (p < 0.0001) was tested with an two-tailed, exact Mann-Whitney test. (C) The threshold value (blue dot) of 8.24% CD8 T cell-mediated virus inhibition was determined by maximizing the true positive rate (probability a participant has a positive value for percent inhibition, given they are seropositive) and minimizing the false positive rate (probability a participant has positive value for percent inhibition, given that they are seronegative). This threshold value is shown as the dashed line in (B, D) Estimates for % inhibition [Equation (1)] and corresponding 95% CI [Equation (6)] in HIVART participants (n = 6) over time. Each line = data from 1 participant. Virus inhibition measured on Day 7 does not correlate with T cell responses (E) to the HIV clade B proteome measured by overnight IFN-γ ELISpot (n = 12, r = -0.03, p = 0.94; two-tailed Spearman’s rank correlation) or (F) to the HIV optimal epitopes (CTLA+CTLB) measuring % of CD107a+perforinlow CD8 T cells (n = 9, r = -0.08, p = 0.84; two-tailed Spearman’s rank correlation) by 6hr ICS or (G) %MIP-1β+TNF-α+ CD8 T cells (n = 9, r = -0.09, p = 0.82; two-tailed Spearman’s rank correlation); dashed line = threshold, HD = healthy, HIV seronegative donor, HIVART = PLWH durably suppressed with ART; (E–G) black symbol = %inhibition measured at a single timepoint as shown in (C), red symbol = average % inhibition over time as shown in (D).

