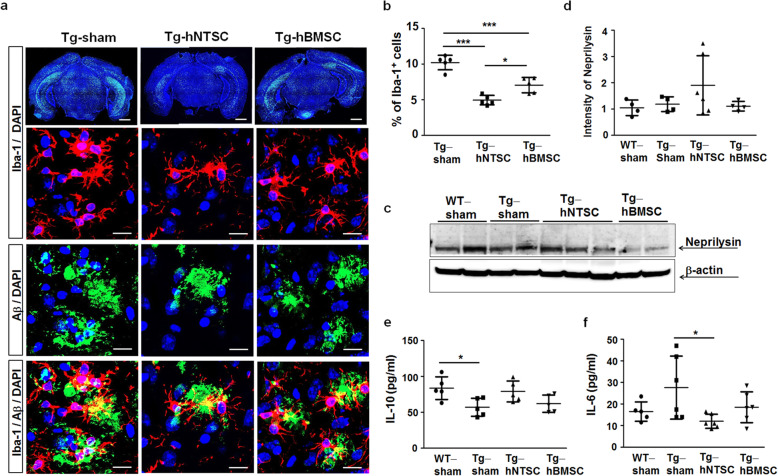
Fig. 3.
Effects of hNTSC transplantation on the number of inflammatory microglia in 5 × FAD mouse brains. a Confocal microscopy images of the brains in Tg-sham, Tg-hNTSC, and Tg-hBMSC mice after double staining of OCT-embedded sections with antibodies for Iba-1 to detect microglia (green, red) and 6E10 (green) at 7 weeks after stem cell transplantation. Clustered microglial cells were detected in the vicinity of Aβ plaques in the brain tissue. Nuclei were labeled with DAPI (blue). Scale bars: 1000 μm, 20 μm. b Iba-1-positive cells were counted in the hippocampus and cortex (n = 5 per group). Values are the mean (SD). For the nonparametric multiple comparison tests, one-way ANOVA was used to determine whether group differences were statistically significant. *P < 0.05, *** P < 0.001. c Western blots of SDS-PAGE gels of proteins extracted from the brain tissues of WT-sham, Tg-sham, Tg-hNTSC, and Tg-hBMSC mice using a primary anti-NEP antibody at 7 weeks after stem cell transplantation. β-actin was used as a loading control. d Values are the mean (SD). e, f The levels of the anti-inflammatory cytokines IL-10 and IL-6 proinflammatory cytokines in the brain tissue lysates of Tg-sham, Tg-hNTSC, and Tg-hBMSC mice were analyzed by specific ELISA at 7 weeks after stem cell transplantation (n = 5–6 per group). Values are the mean (SD). For the nonparametric multiple comparison tests, one-way ANOVA was used to determine whether group differences were statistically significant. *P < 0.05. All images and data are representative of three independent experiments

