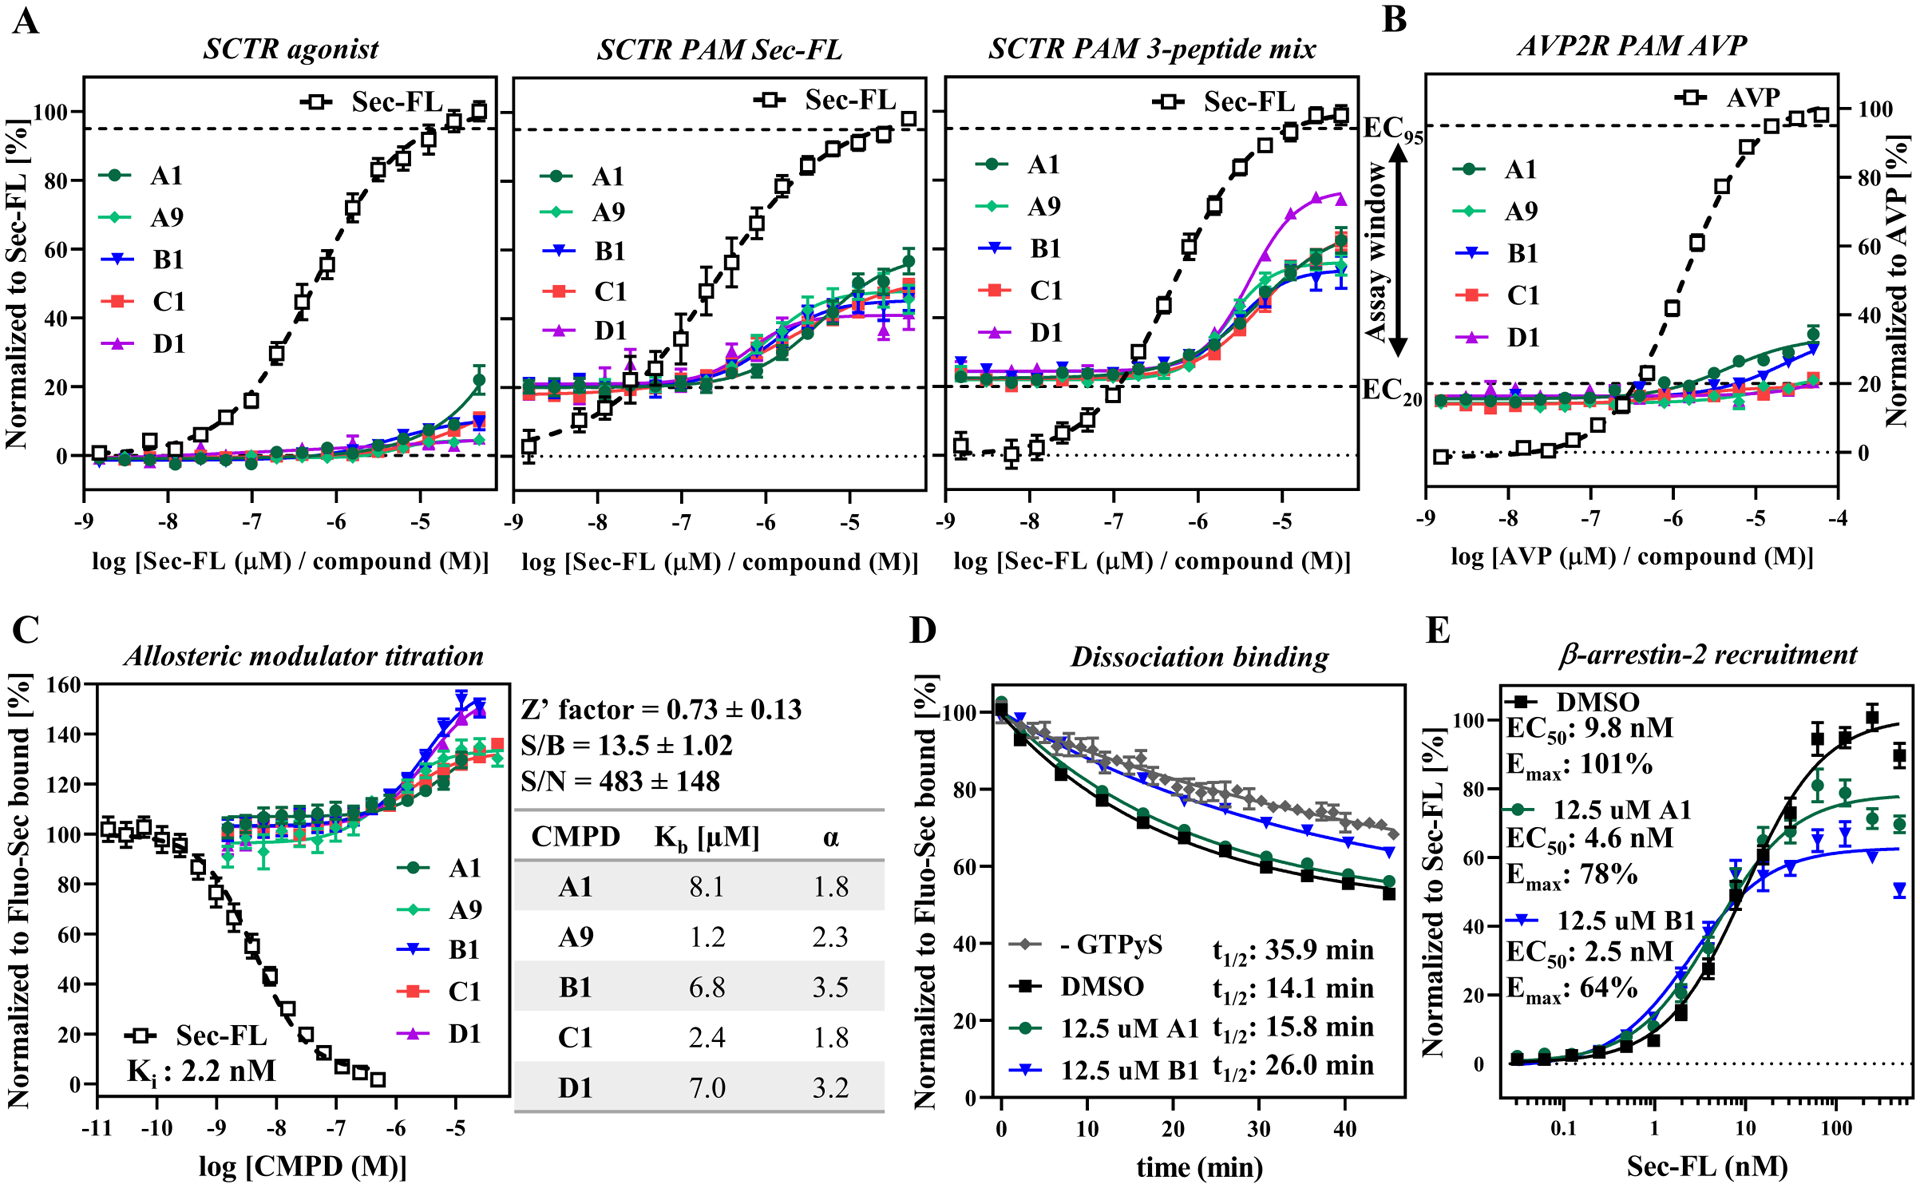
Figure 6: Validation and characterization of scaffold A, B, C and D:

from left to right: Compound titration on (A) SCTR-bearing CHO-K1 cells detected by Cisbio GsD agonist (no stimulant), Cisbio GsD Sec-FL (stimulant EC20 Sec-FL), Cisbio GsD 3 pep mix (stimulant EC10 Sec-FL, Sec(1–23) and Sec(3–27)) or on (B) AVP2R-expressing CHO-K1 cells via Cisbio GsD kit (stimulant EC20 AVP); (C) Allosteric modulator titration using TR-FRET binding assay in high-throughput mode (assay performance data right to graph) and subsequent analysis in GraphPad Prism yielding allosteric activity parameters Kb (equilibrium dissociation constant of PAM) and α (cooperativity factor). (D) CMPD B1 demonstrating effect on Fluo-Sec dissociation comparable to presence of G protein (− GTPγS). (E) CMPD A1 and B1 slightly enhance potency but diminish efficacy of Sec-FL for recruitment of β-arrestin-2. (A, B) TR-FRET ratios resulting from cAMP accumulation normalized to full agonist, (C, D) LanthaScreen ratios normalized to Fluo-Sec bound or (E) RLU normalized to Sec-FL. (A) - (E) CMPD A1 (dark green), A9 (light green), B1 (blue), C1 (red) and D1 (purple); graphs plotted using GraphPad Prism; experiments performed in duplicate or triplicate in at least three independent experiments; data points shown as mean ± SEM.
