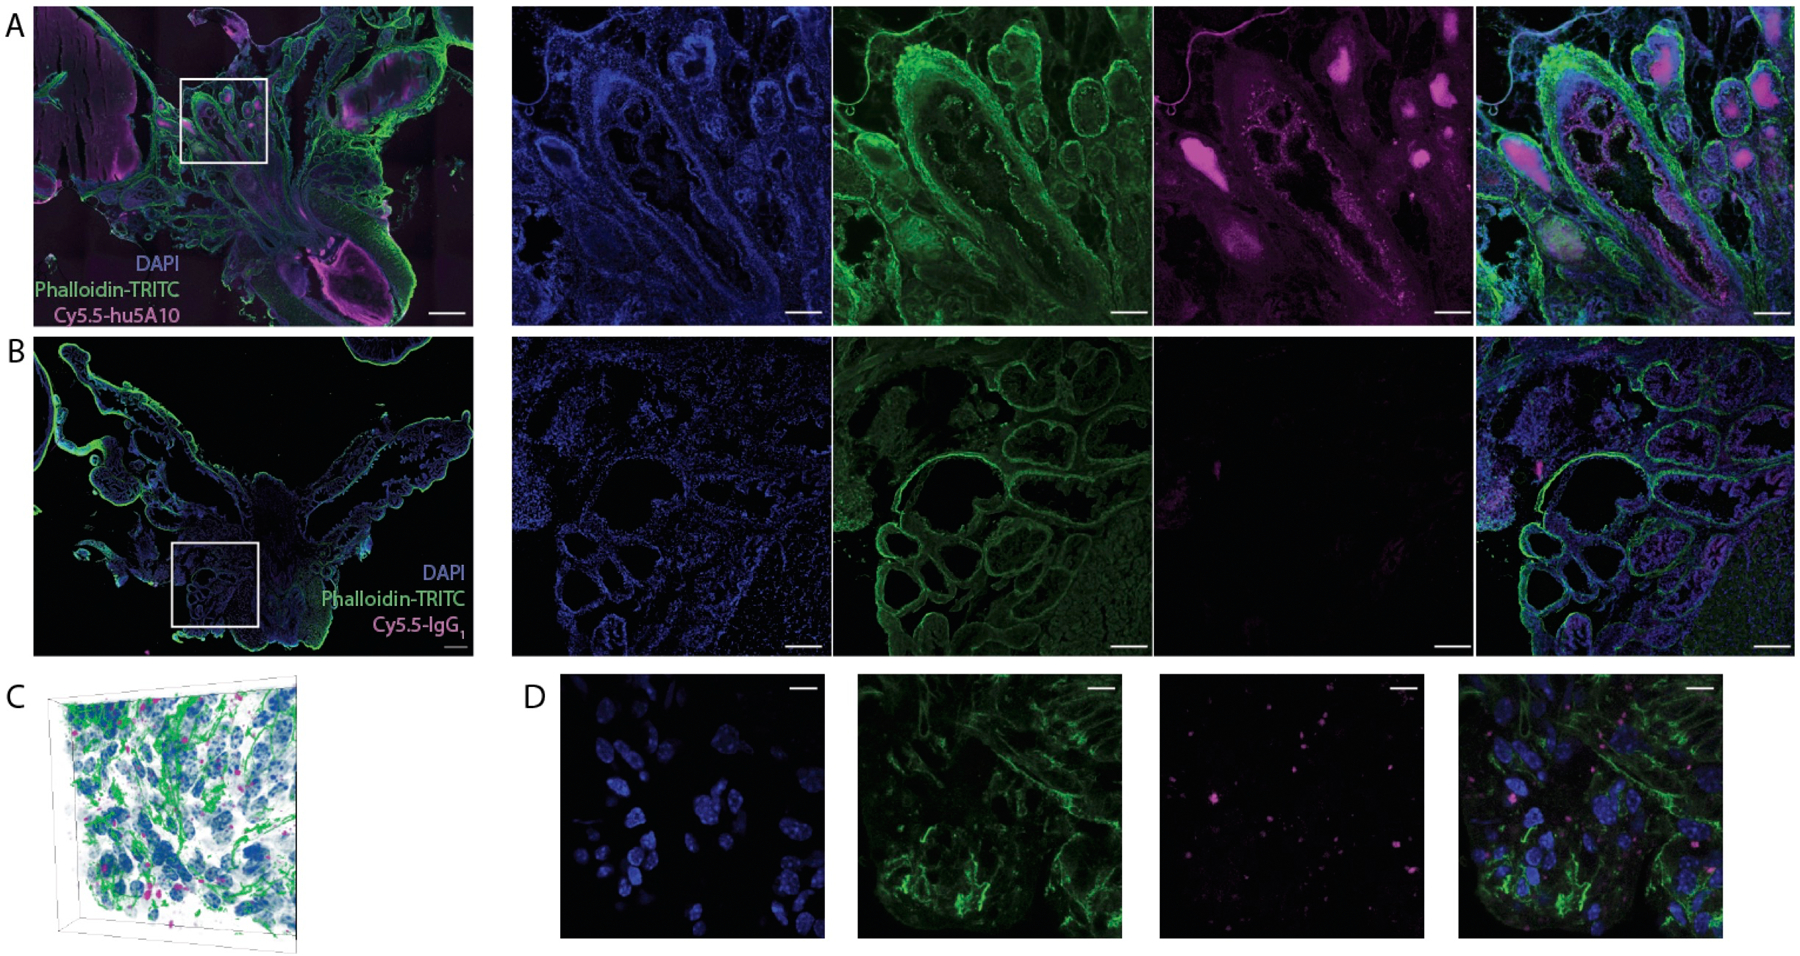
Figure 3. Subcellular localization of hu5A10.

(A,B) Representative tissue section (100µm) through the prostate gland and seminal vesicles of a KLK3_Hi-MYC mouse at 120 h p.i. of either PSA-targeted antibody (Cy5.5-hu5A10; 1 out of 5 is shown) (A) or control (Cy5.5-IgG1; 1 out of 5 is shown) (B); composite image followed by individual channels from right to left. Concentration of the PSA-targeting Cy5.5-hu5A10 is noted in luminal structures as well as diffusely in the seminal vesicles. No signal in the Cy5.5 channel is noted following Cy5.5-IgG1 administration. Scale bar for composites is 500µm; 200µm for panels. (C,D) Microscopy three-dimensional data (C) of the distribution of the fluorescent Cy5.5-hu5A10 throughout the dorsolateral prostate (1 out of 5 is shown). The center slice through the prostate volume in C is shown for each channel (antibody, cell nuclei and actin) (D). Transport of Cy5.5-hu5A10 through the luminal PSA-expressing cells is noted, indicating internalization. The scale bar represents 40µm.
