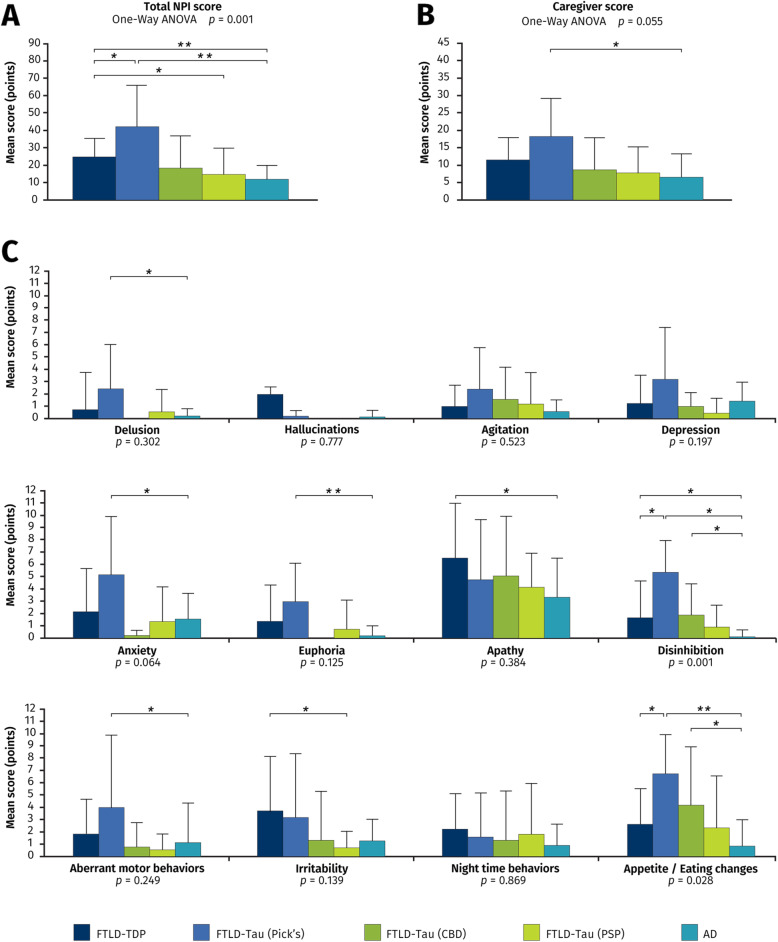
Fig. 1.
Neuropsychiatric symptoms at baseline. Mean score and standard deviation on the Neuropsychiatric Inventory (NPI) for all of the pathological subgroups. A Total NPI score. B Caregiver score. C Subscale items. P values for differences between subgroups (ANOVA) are found underneath graphs. All bars in the figure are significant differences between each pair with * = P < 0.05 and ** = P < 0.005. Abbreviations: AD Alzheimer’s disease, CBD corticobasal degeneration, FTLD frontotemporal lobar degeneration, PSP progressive supranuclear palsy

