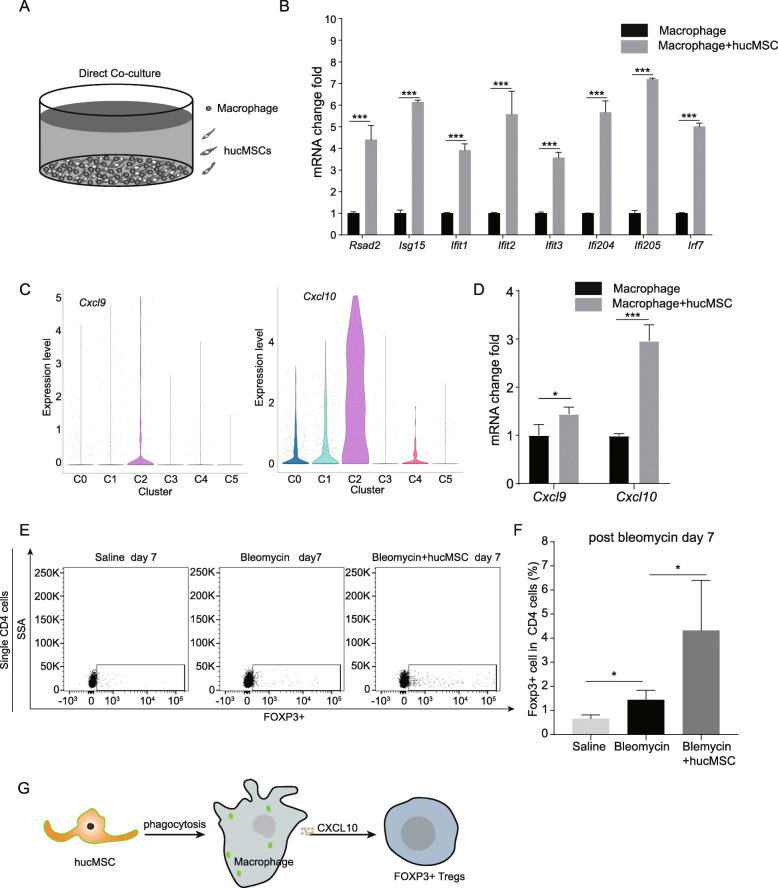
Fig. 5.
Macrophage and hucMSCs interaction increased interferon-responsive gene expression in macrophages. A Diagram of macrophage and hucMSCs co-culture. B Rsad2, Isg15, Ifit1, Ifit2, Ifit3, Ifi204, Ifi205, and Irf7 expression levels in macrophage co-cultured hucMSCs (mean ± SD, n = 3 wells per group). C Violin plots of Cxcl9 and Cxcl10 in each macrophage cluster. D Cxcl9 and Cxcl10 expression levels in macrophages co-cultured with hucMSCs (mean ± SD, n = 3 wells per group). E Flow cytometry analysis of Foxp3 regulatory T cells in saline-treated mice lungs, bleomycin-treated mice lungs, and hucMSC-treated mice lung. F Quantification of Foxp3-positive Tregs in saline-treated mice lungs, bleomycin-treated mice lungs, and hucMSC-treated mice lungs at day 7 (mean ± SD, n = 3 mice per group). G Working model showing that hucMSCs interact with macrophage to recruit Tregs into lung. *p < 0.05, ***p < 0.001, n.s. no significant difference, Student’s t-test

