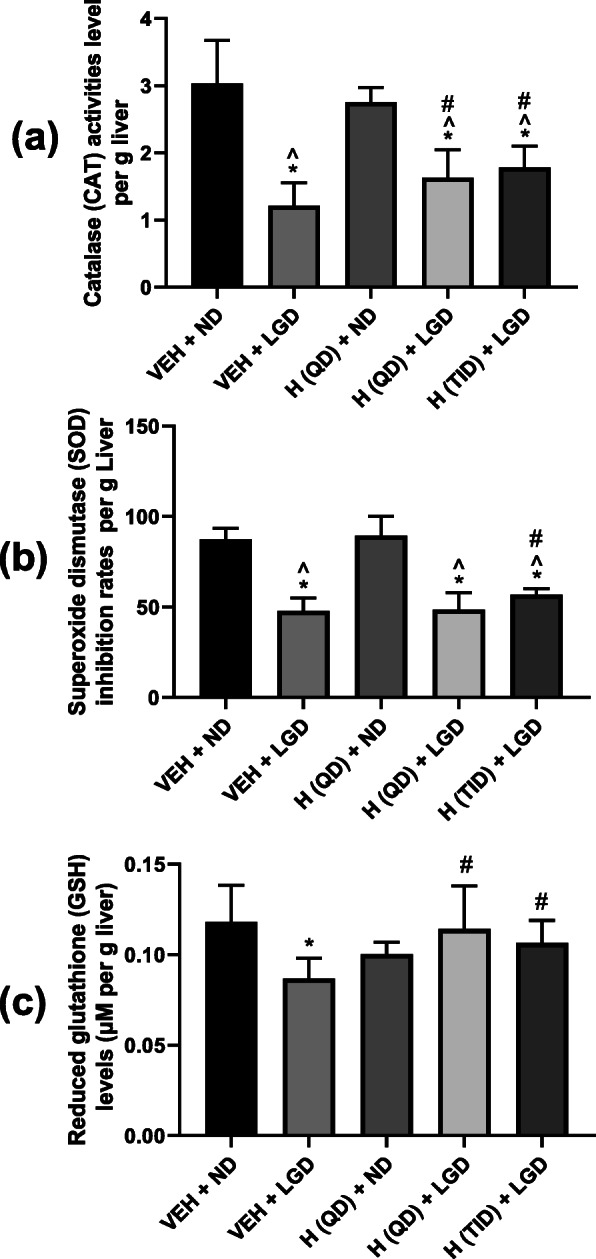
Fig. 6.

Comparisons of Catalase (CAT) activities (a), Superoxide dismutase (SOD) inhibition rates (b) and Reduced glutathione (GSH) levels (c) in liver from different treatment groups for evaluating the anti-oxidative effect of Hitrechol®. n = 4 to 6 for each treatment group. Data presented in Mean ± SD, *p < 0.05 compared to VEH + ND group, ^p < 0.05 compared to H (QD) + ND group, #p < 0.05 compared to VEH + LGD group analyzed by one-way ANOVA followed by Tukey’s multiple comparisons test. VEH: Vehicle; ND: Normal diet; LGD: Lithogenic diet; H (QD): Hitrechol® once daily; H (TID): Hitrechol® three times daily. VEH + ND: Group 1; VEH + LGD: Group 2; H (QD) + ND: Group 3; H (QD) + LGD: Group 4; H (TID) + LGD: Group 5
