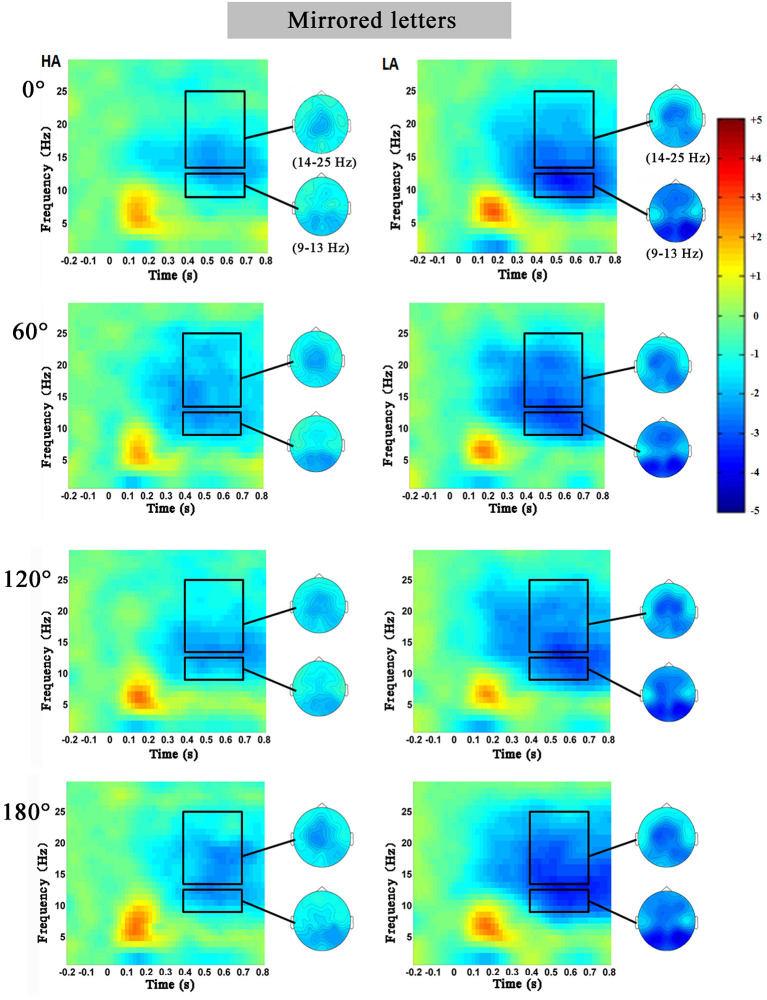
Figure 4.
The average time–frequency spectrum power on PZ electrode at the mirrored letters for the high-altitude (HA) and the low-altitude (LA) groups during the mental rotation task. The black rectangle was the oscillation power in the alpha and beta bands, and on the right was the corresponding topographical map.

