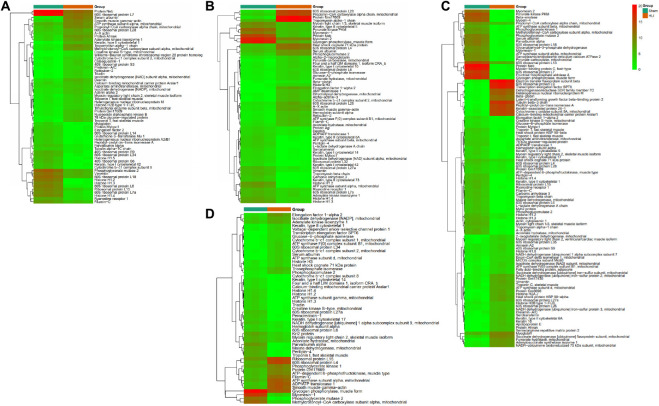
FIGURE 6.
Heat map showing the differentially expressed proteins at each time points. The heat map shows the differentially expressed proteins at days 1 (A), 3 (B), 7 (C), and 14 (D). Each row represents a differentially expressed protein and each column, sample replicate. The color scale illustrates the relative level of differentially expressed protein expression: red, higher than the reference channel; green, lower than the reference.

