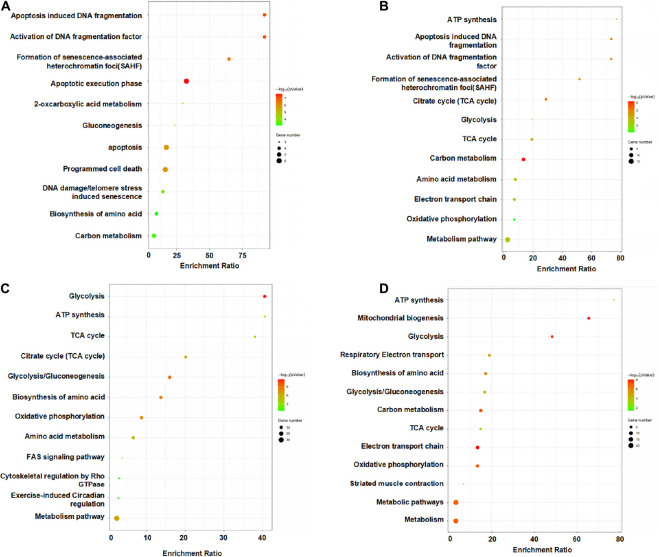
FIGURE 7.
Pathway analysis of the differentially expressed proteins from the MSCs in HLI vs. Sham at each time points. KEGG enrichment analyses of DEPs from the MSCs in HLI vs. in Sham hindlimb at days 1 (A), 3 (B), 7 (C), and 14 (D). KEGG pathway analysis of DEPs indicated a remarkable difference in cellular functions between HLI and Sham. Bubble graphs describe the distribution of DEPs in a classified KEGG pathway. The bubble size represents the differential protein expression level. The red bubbles show that the protein level in HLI is higher than that in Sham, whereas the green bubbles show the opposite trend.

