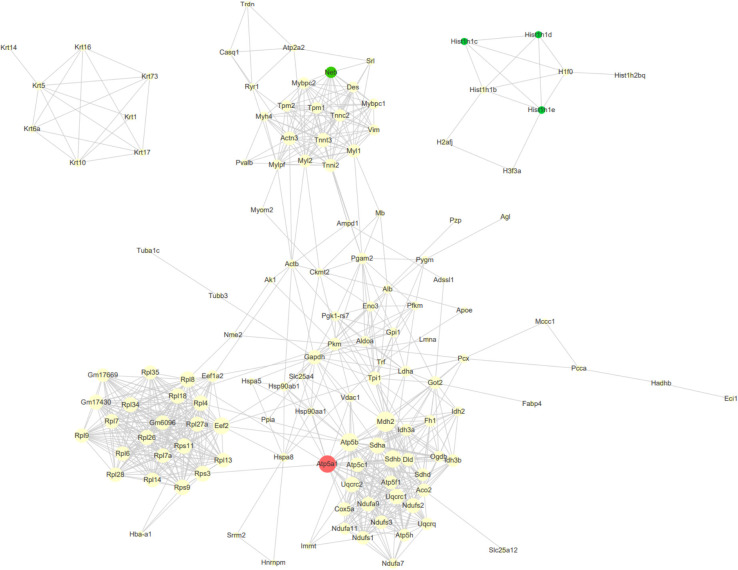
FIGURE 8.
Protein-protein interaction (PPI) network analysis of DEPs. Network analysis using CytoScape of the MSC proteins interactome reveals clustering around nodes involved in apoptosis, metabolism and structural maintenance. The degree of a node indicates the number of connections to other nodes, edge thickness indicates the degree of interactions. The red nodes indicated consistently upregulation DEGs at four time points, and the green nodes indicated consistently downregulation DEGs.

