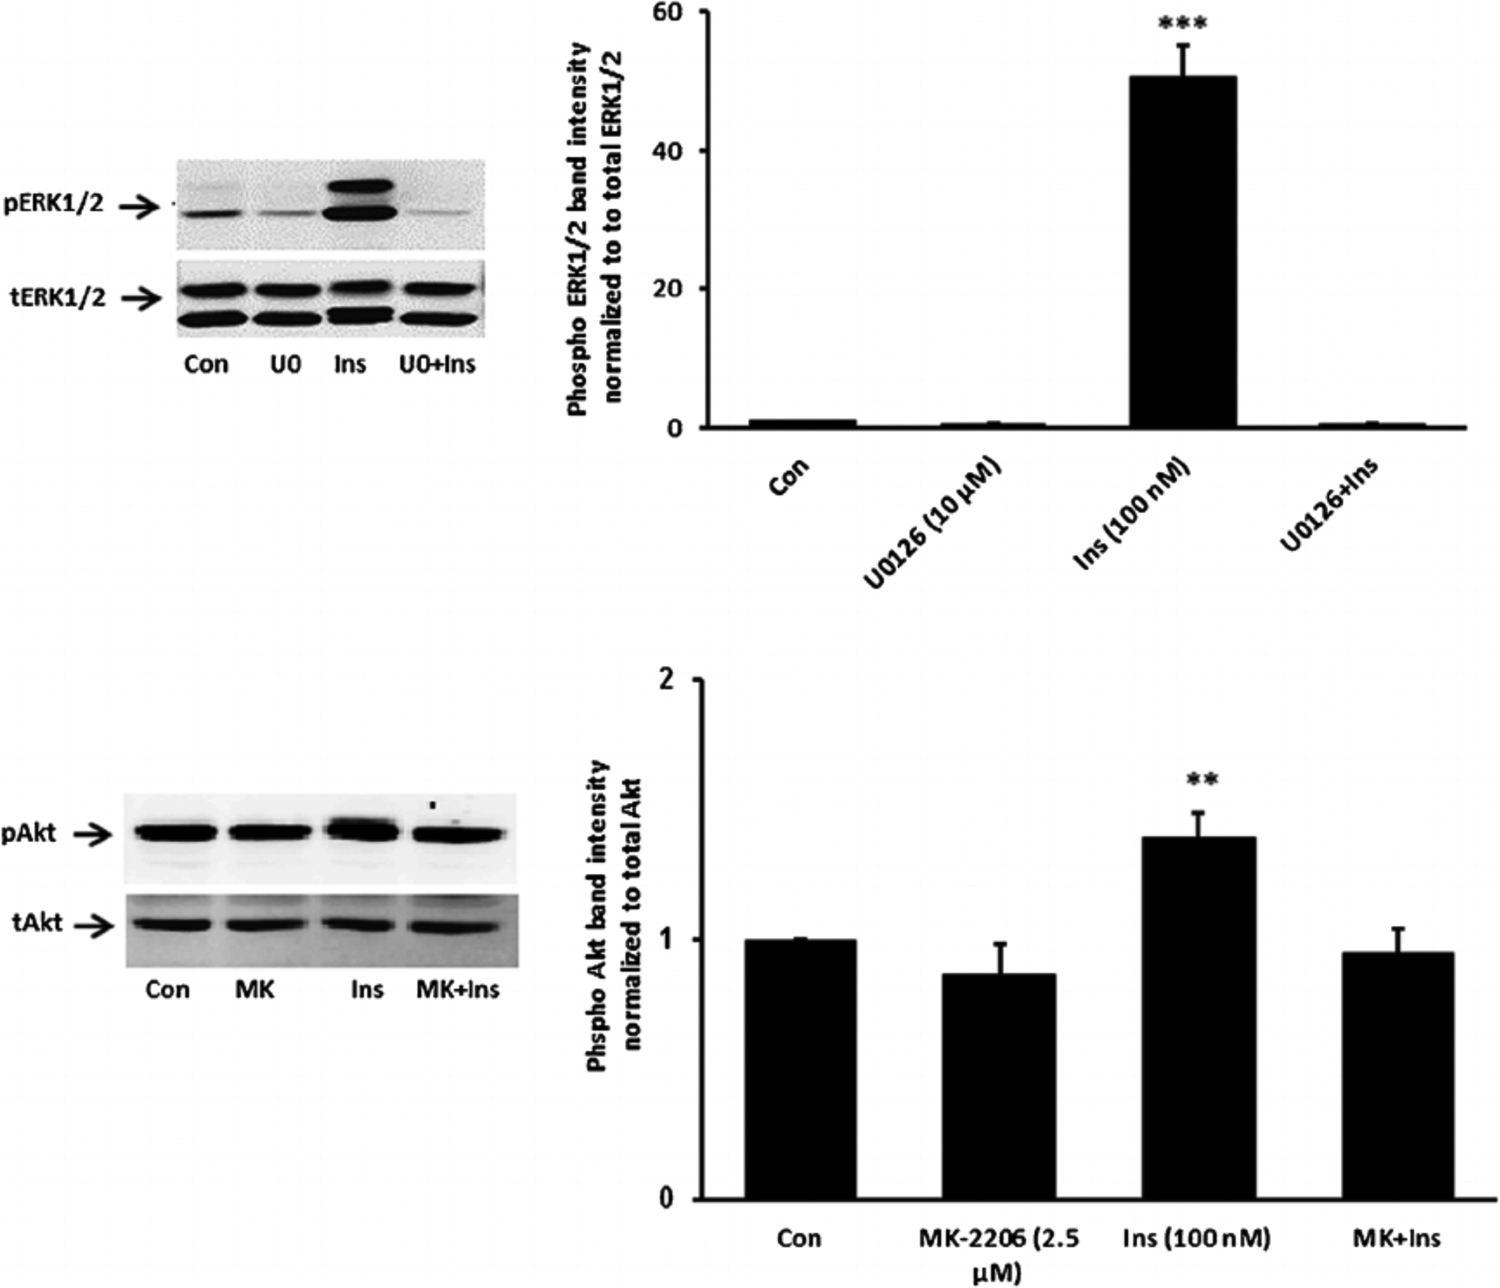
Fig. 5.

Inhibition of ERK1/2 and Akt activation responses to insulin. Cells were pretreated with an ERK inhibitor U0126 (10 μM) or an Akt inhibitor MK-2206 (2.5 μM) for 20 min and then were exposed to insulin (100 nM) for 5 min before Western blot analysis for pERK1/2 and total ERK1/2 (upper part) and pAkt and total Akt (lower part). Some cells received insulin alone and control cells received neither insulin nor inhibitor. Each part shows a representative Western blot on the left and on the right the mean ± SEM of band density from three independent experiments. **(P < 0.01) and *** (P < 0.001) indicate significant differences from control.
