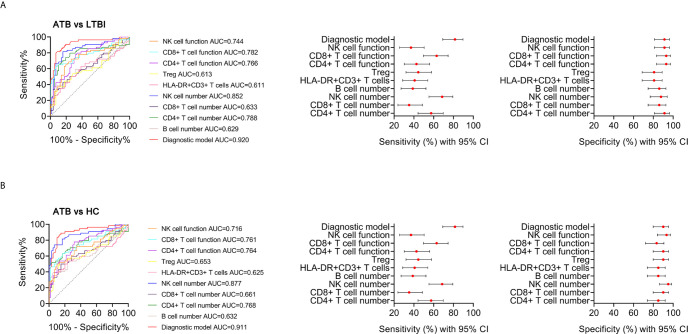
Figure 8.
The performance of various indicators in discriminating ATB from LTBI and HC. (A) ROC analysis showing the performance of various indicators in discriminating ATB patients from LTBI individuals. Liner plots showing the sensitivity and specificity of different indicators as well as their 95% CI. (B) ROC analysis showing the performance of various indicators in discriminating ATB patients from HC. Liner plots showing the sensitivity and specificity of different indicators as well as their 95% CI. ATB, active tuberculosis; LTBI, latent tuberculosis infection; HC, healthy controls; AUC, area under the curve; CI, confidence interval.

