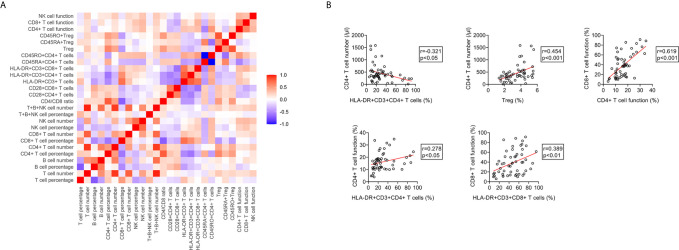
Figure 9.
The relationship between different immune indicators in ATB patients. (A) Heatmap showing the relationship different immune indicators in ATB patients. (B) Scatter plots showing the correlation between the number, phenotype, and function of lymphocytes in ATB patients. Each symbol represents an individual donor. ATB, active tuberculosis.

