FIGURE 3.
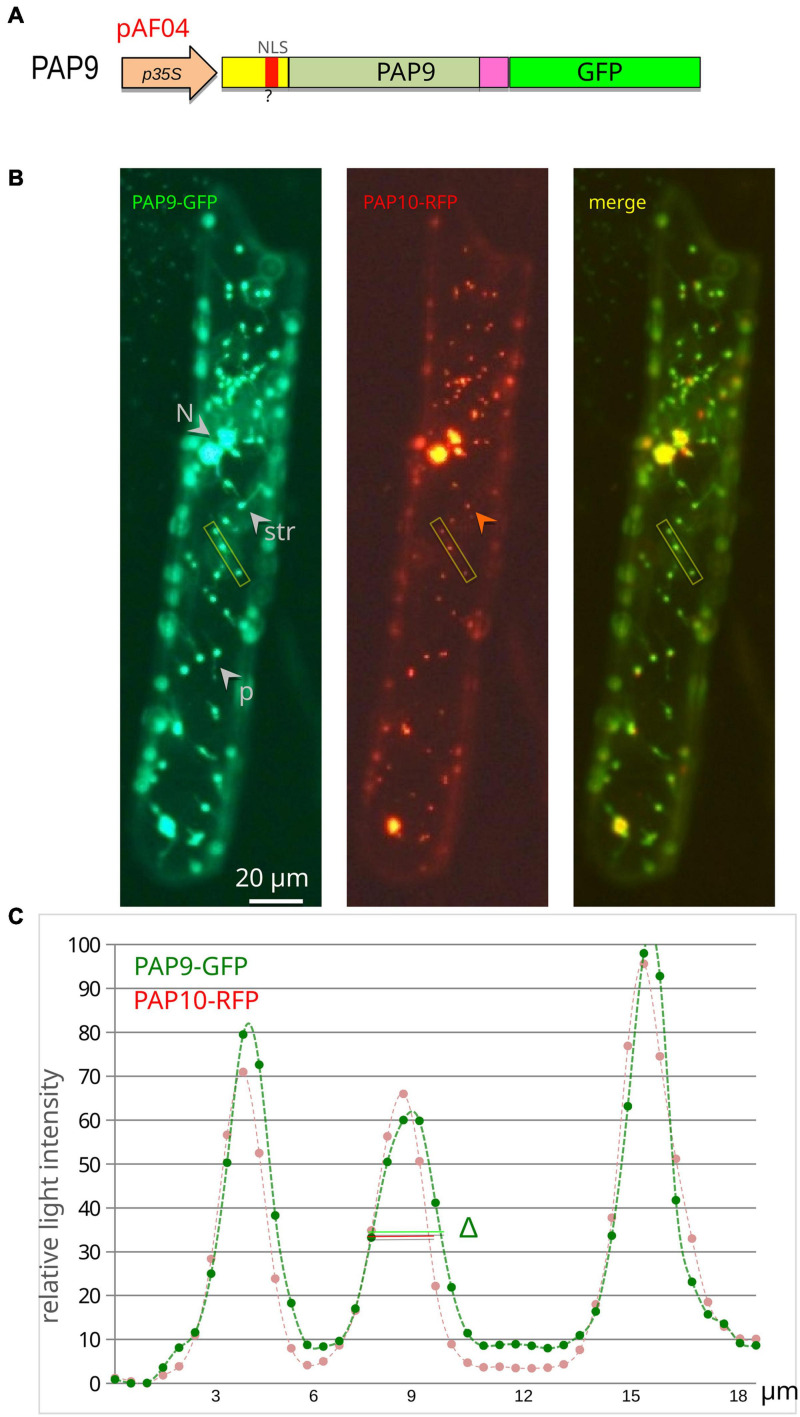
PAP9 is localized in plastids. (A) Schematic illustration of the PAP9-GFP construction in pAF04. p35S, CaMV35S promoter region; cTP, chloroplast transit peptide in yellow; ?, predicted NLS (nuclear localization signal) in red; C-terminal domain in magenta; GFP in green. (B) Transiently expressed PAP9-GFP in onion epidermal cells. N, nucleus; str, stromule; p, plastid. The red arrowhead points to the absence of red fluorescence in stromules. The yellow rectangle represents the analyzed segment in panel (C). (C) Fluorescent signal quantitative profile on an 18-μm-long segment of the image across three plastids. Δ represents the difference in width of the GFP signal compared to the red signal of PAP10-RFP.

