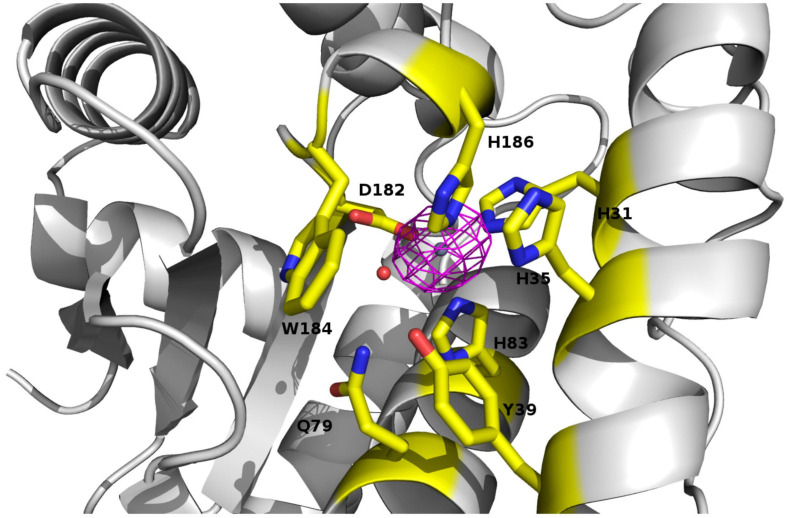
FIGURE 6.
View of the catalytic site of PAP9 superimposed with the anomalous electron density map calculated at the zinc K-edge. Residues of the catalytic site and closing the catalytic site are drawn in sticks. The zinc ion is drawn as gray sphere. The water molecule corresponding to the hydroxide ion is represented as a red sphere.

