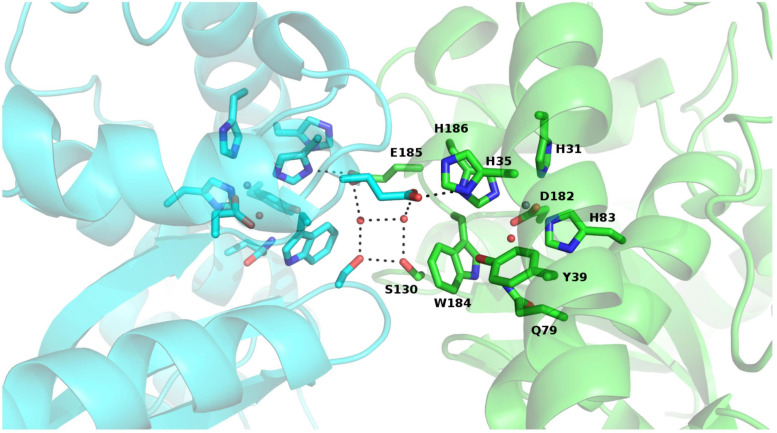
FIGURE 7.
View of the conserved interactions between both monomers of PAP9 and observed in FeSODs, with each monomer of PAP9 in a different color. The residues involved are drawn in sticks, the hydrogen bonds are represented in dark dashed lines and the water molecules are shown as spheres. The zinc ion is drawn as gray sphere. The β-strands are drawn in arrows and the α-helices are represented in ribbons.

