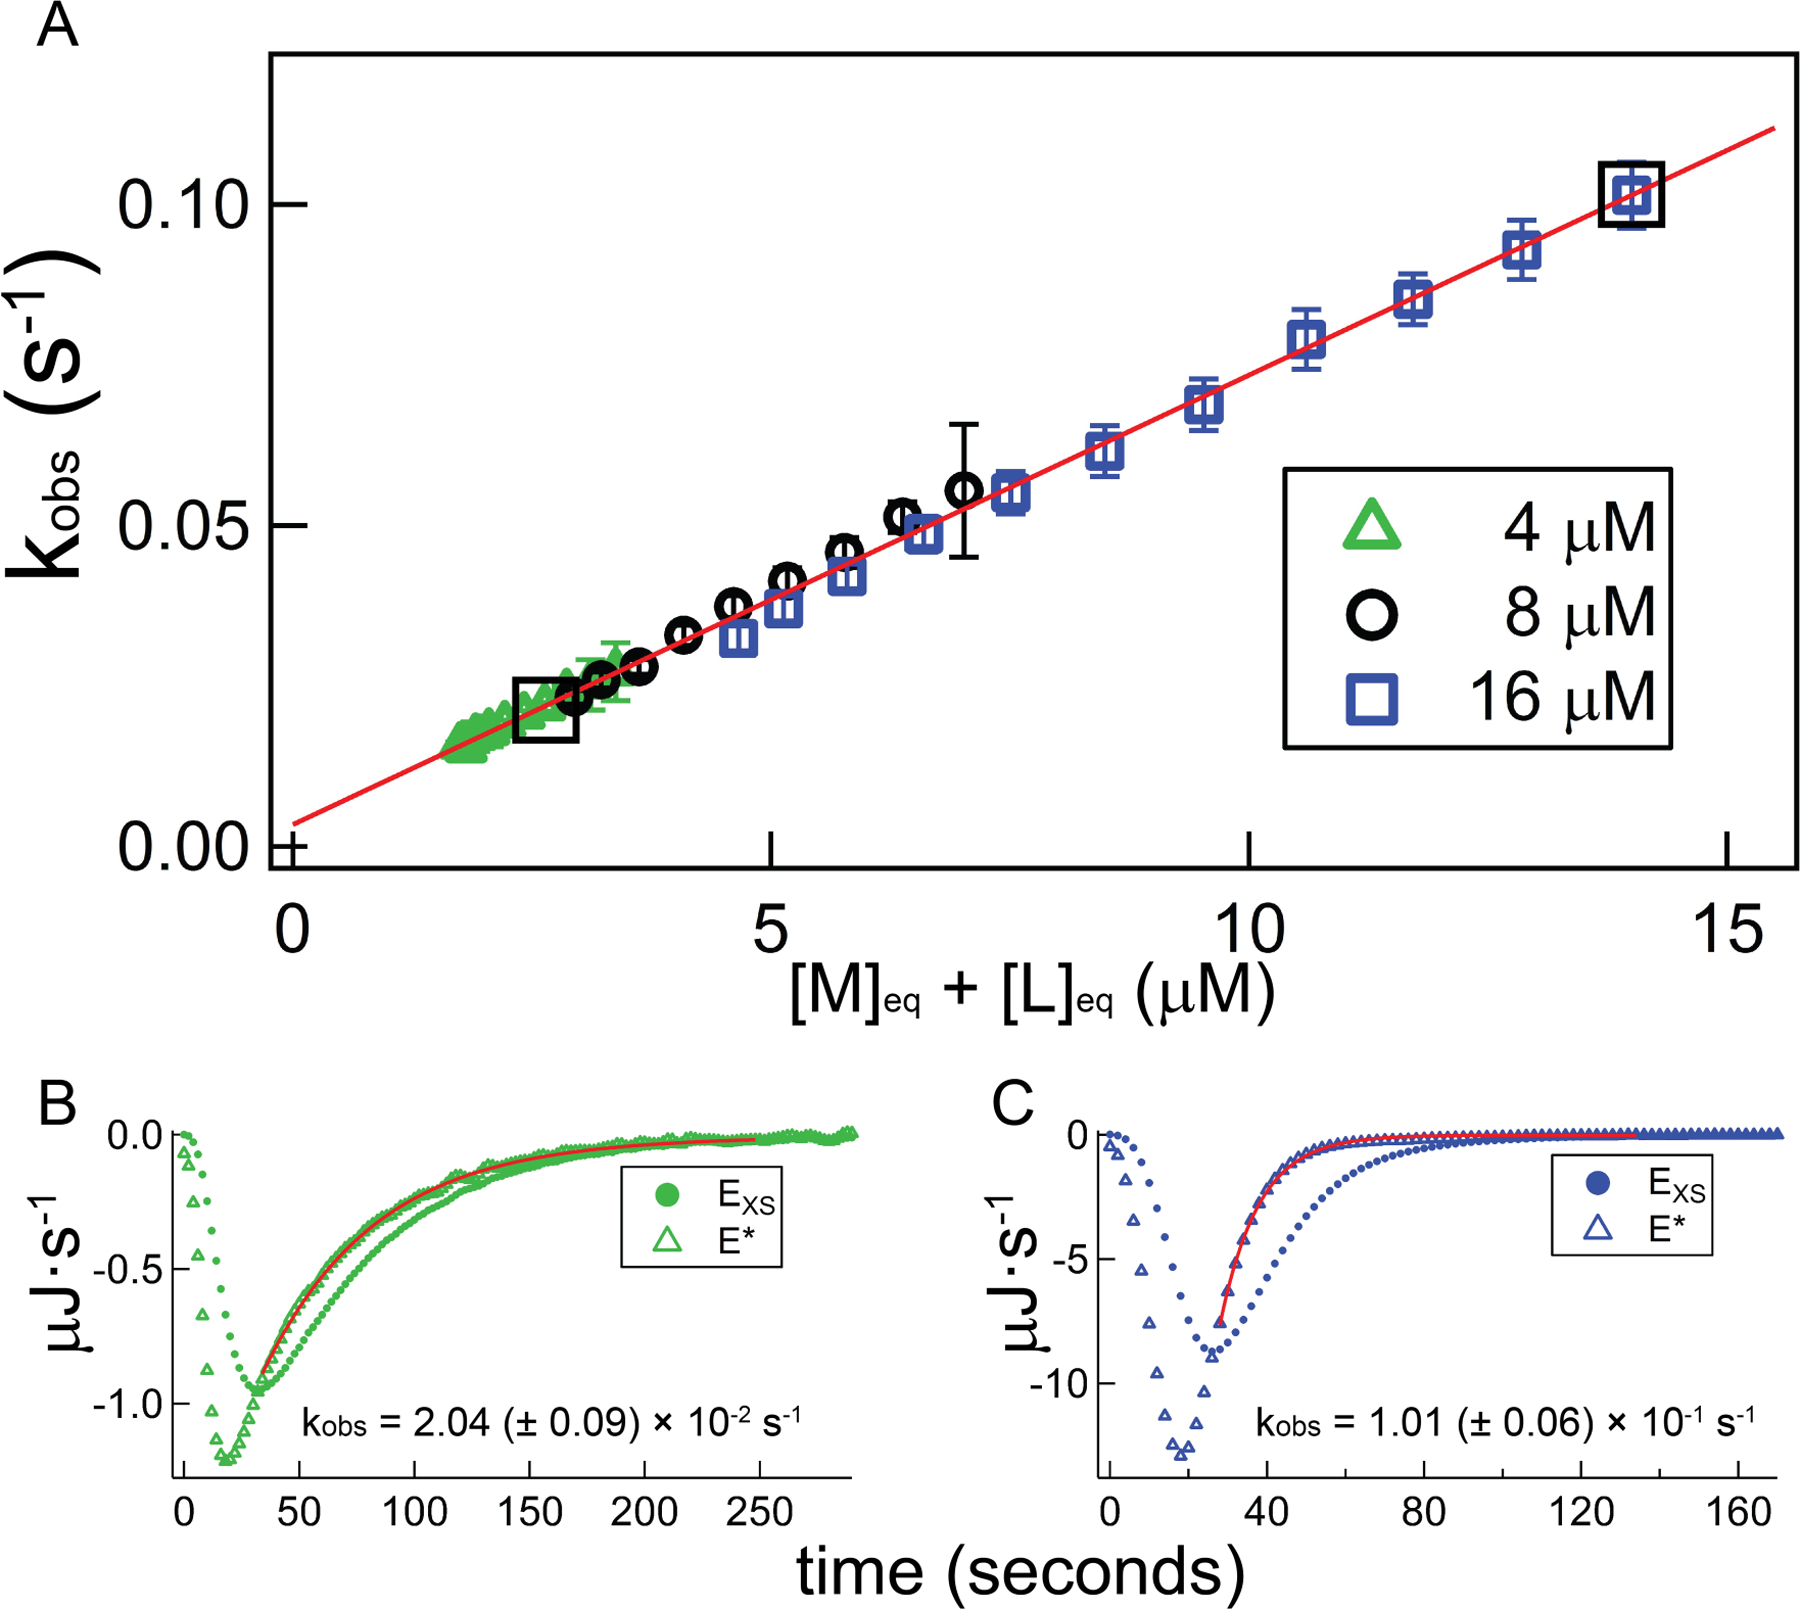
Figure 5.

Demonstration of consistency in the near-equilibrium approximation at the upper end of the calorimetry-accessible kinetics window, using TT – RR experiments across a range of [M]init at the experimental condition 200 mM KCl, 25 °C. A) Plot of best-fit kobs against unbound RNA for a set of TT – RR titrations in which [M]init was varied. For all experiments, the syringe ligand (TT) concentration is 240 µM; green triangles, black circles, and blue squares reflect separate experiments in which the starting cell concentration of RR ([M]init.) is 4 µM, 8 µM, or 16 µM, respectively. The red trendline is the result of a global, linear fit; results from the individual datasets are provided in Table 2. Bottom panels: demonstration of increasing importance of deconvolution for fast association kinetics. Plots depict power traces before (EXS; closed circles) and after (E*; open triangles) deconvolution using the 6th injection from the 4 µM dataset (Panel B) and the 2nd injection from the 16 µM dataset (Panel C) as examples. Red curves plot best-fit exponential functions and fit intervals, and associated composite rate constants (kobs) are listed. The listed uncertainties reflect only injection-level sources (see 4.2.3). Boxed data points in Panel A correspond to the injections displayed in Panels B and C.
