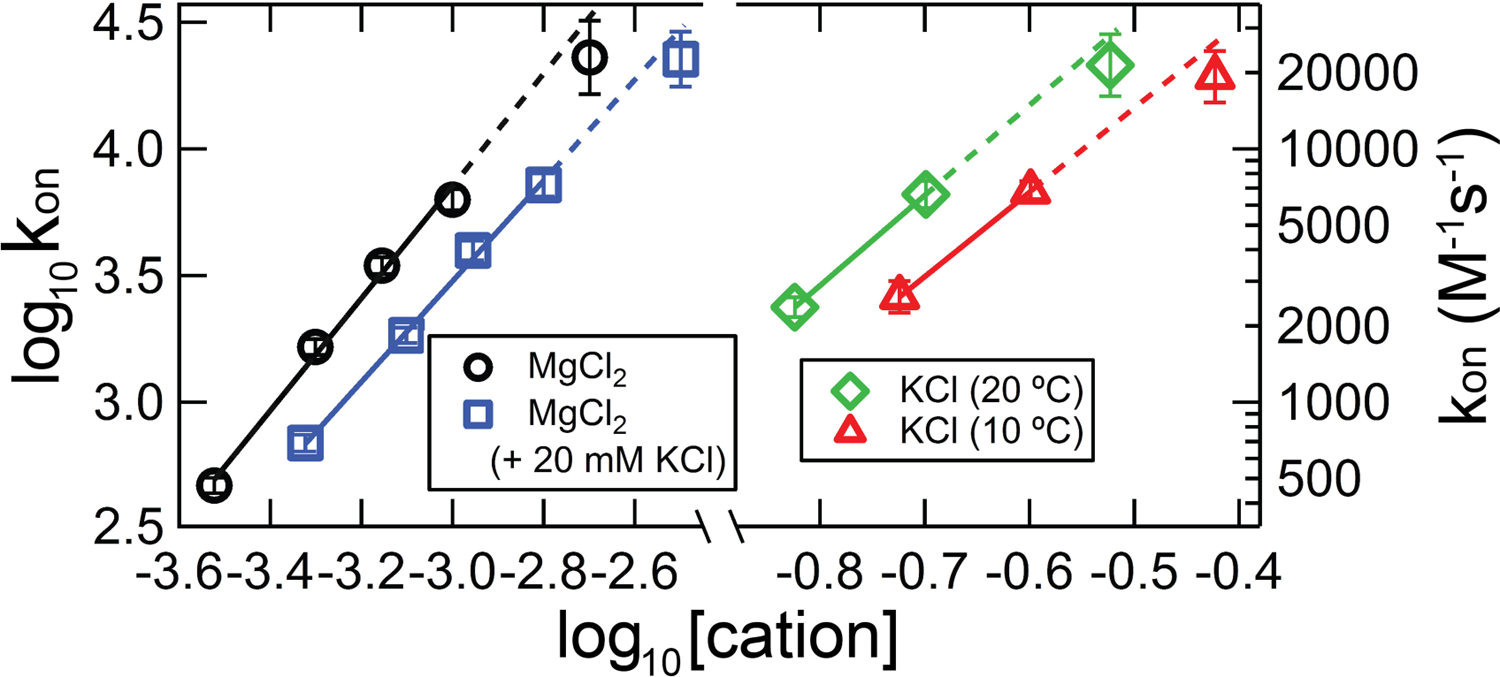
Figure 7.

kon measurements and predictions from extrapolation of the [salt]-dependence, for TT – RR experiments exhibiting kinetics at the upper limit of accessibility by titration calorimetry. Black circles, experiments conducted in solutions containing varying concentrations of MgCl2 at 30 °C. Blue squares, experiments conducted in varying [MgCl2] and 20 mM KCl at 30 °C. Green diamonds and red triangles, experiments conducted in 200 mM KCl at 20 °C or 10 °C, respectively. The solid lines represent kon from titration experiments within the validated region (kon·[M]init < kITC), and the dotted lines extend those fits to the test data. (For visualization purposes, the blue and red datasets have been shifted to the right by 0.2 and 0.1 log units, respectively, such that they do not overlie the adjacent datasets.)
