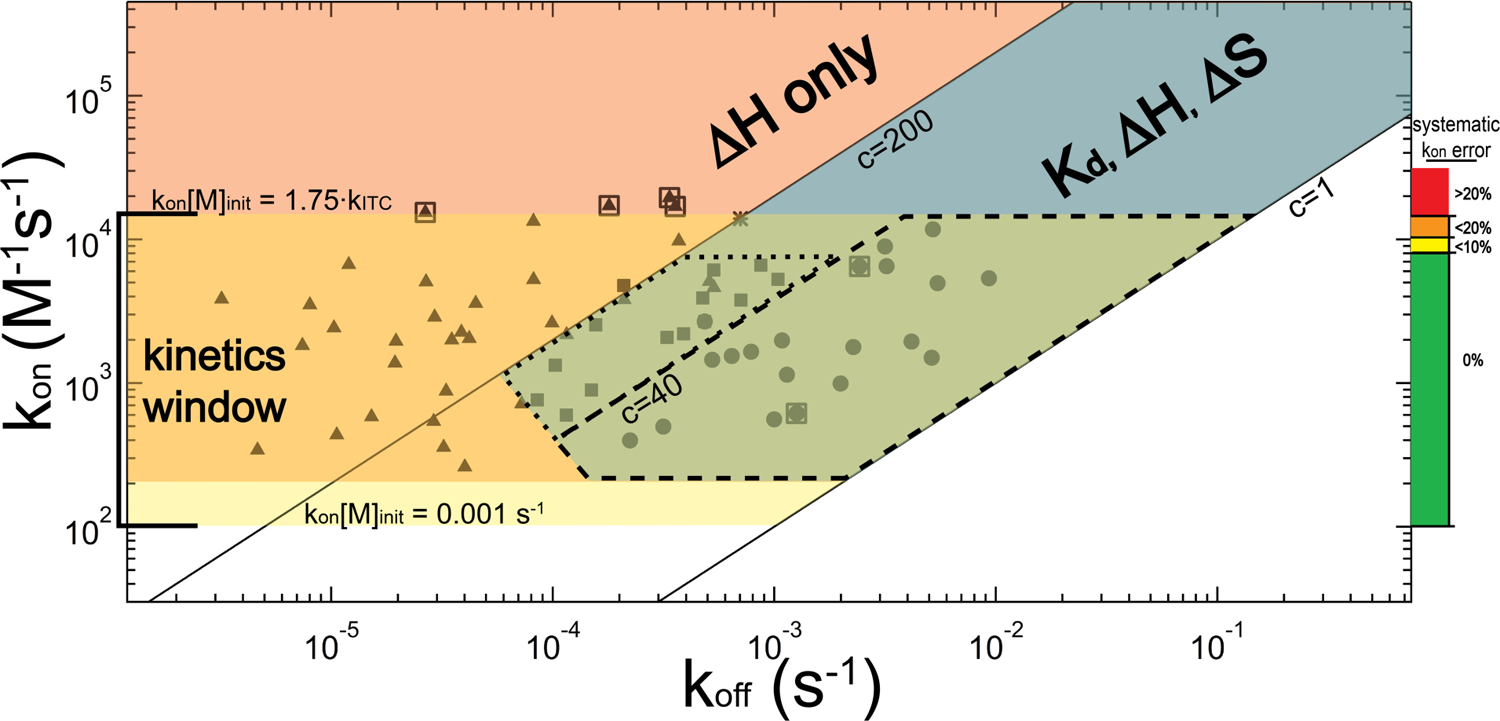
Figure 8.

Relationship between the kinetics (kon and koff) and the attainable thermodynamic and kinetic parameters by ITC, illustrated for a titration experiment conducted with [M]init = 10 µM and instrument time constant of 12.5 seconds. The three main regions for consideration are denoted in blue, salmon and yellow; corresponding overlapping regions are colored accordingly. The blue diagonal band represents the optimal thermodynamics regime for ITC in which 1 ≤ c ≤ 200, and for which the full complement of thermodynamic information (Kd, ΔH and subsequently ΔS) can be obtained. The salmon-colored region above the c = 200 line reflects the tight-binding regime for which, thermodynamically, only ΔH can be obtained. The horizontal yellow band represents the kinetics regime (1 × 10² M−1s−1 < kon ≤ 1.4 × 10⁴ M−1s−1). Within a subrange of the overlap of the kinetic regime with the optimal thermodynamic regime (largely consisting of 1 ≤ c ≤ 40) is the near-equilibrium approximation regime, marked by dashed lines, for which this approximation is valid over the entirety of the titration. A dotted line encloses an adjacent region where, in our experience, the near-equilibrium approximation yields kon values consistent with the general method. Closed symbols denote the regions within this map that we have examined using TT – RR, and the asterisk reflects the AdoMet-SET7/9 experiment. Symbol positions are “concentration-adjusted” such that they reflect the rate constants that would exhibit the experimentally-observed kinetics if all experiments were conducted at [M]init = 10 µM. TT – RR closed circles and squares represent average kinetic parameters obtained at an experimental condition where kon and the full complement of thermodynamic information were obtained (corresponding data are provided in Table 4). For data represented as circles (c < 40) koff was also obtained independently of the Kd using the near-equilibrium approximation. Triangles represent conditions where we were able to obtain kon, but only ΔH in terms of thermodynamics. For these experiments, a Kd extrapolated from the [salt]- or temperature-dependence for TT – RR association was employed in the general equation; alternatively, for experiments in which c > 200, the tight-binding approximation could have been used to avoid this extrapolation requirement (additionally ∂kon/∂Kd is rather negligible if c > 200 so precise knowledge of Kd is not required). The koff for these datasets (as well as that of AdoMet-SET7/9), however, is known only as accurately as is the Kd and thus the associated uncertainty would be quite high in some cases. Note the truncation at the lower left of the optimal thermodynamics regime: this denotes a region where slow kinetics prevented our accurate measurement of Kd. Boxed triangles represent data used as maximum rate constant test-cases in Figure 7, and boxed circles were used as near-equilibrium test-cases in Figures 4 and 5. The colored scale and labels on the right chart our inferred deconvolution-introduced error: for kon·[M]init < 0.14, the error should be less than 20% and we set this as the absolute upper-limit for kinetics analysis.
