. 2021 Jun 9;12(27):9420–9431. doi: 10.1039/d1sc01411k

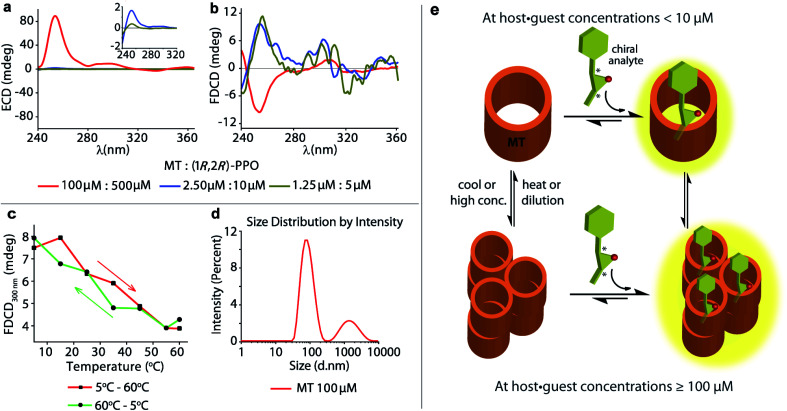
Fig. 5. Concentration dependent (a) ECD and (b) FDCD spectra of freshly prepared MT receptor in presence of (1R,2R)-PPO in water. The inset show the zoomed in ECD signals in the 240 nm to 320 nm region. Parameters used: BW = 4 nm, Acc = 20, LP-filter = 380 nm. (c) FDCD signal at 300 nm of the MT receptor (100 μM) in water on increasing the temperature from 5 °C to 60 °C (red line) and on cooling the solution back from 60 °C to 5 °C (green line). (d) DLS measurements showing intensity distribution versus particle diameter of MT receptor solution (100 μM) in water. Parameters used: material RI = 1.45, dispersant RI = 1.330, viscosity = 0.8872 cP, measurement position = 4.65 mm, attenuator = 11. (e) Schematic representation showing the complex formation between the achiral chromophoric MT host and the chiral epoxides in their non-aggregated state at low concentrations and upon aggregation at higher concentrations and lower temperature.

Fig. 5