. 2021 Jun 9;12(27):9352–9358. doi: 10.1039/d1sc01381e

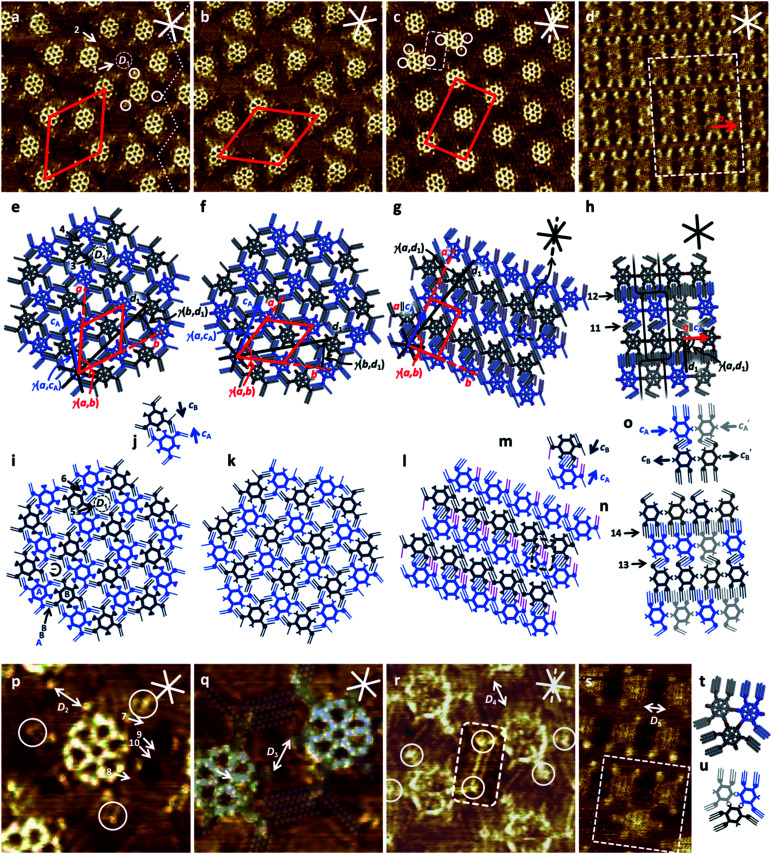
Fig. 2. STM images and (supra-) molecular and schematic models of self-assembled monolayers of 1a and 1b, and of 2a and 2b at the solution/HOPG interface using OA as a solvent. Samples of 1a, 1b, and 2a (a–c and p–r) were thermally annealed for 20 s at 100 °C; samples of 2b (d and s) were thermally annealed for 20 s at 110 °C prior to imaging. (a), (e), (i), (j), (p) 1a (a): 25.5 × 25.5 nm2, p: 7.3 × 7.3 nm2, a, p: VS = −0.6 V, It = 10 pA, c = 1 × 10⁻⁶ M; unit cell: a = b = (8.2 ± 0.2) nm, γ(a,b) = (60 ± 2)°, additional packing/pore parameters: γ(a,cA) = (16 ± 2)°, γ(b,d1) = (18 ± 2)°, pore diameter: D1 = 2.8 nm, C–C distance of carboxylate groups: D2 = 1.5 nm, arrows 1, 3, and 5: hexagonal nanopore; arrows 2, 4, and 6: smaller nanopore with four intercalated OA dimers (arrows 7 to 10); (b), (f), (k), (q) 1b (b): 25.5 × 25.5 nm2, (q): 7.3 × 7.3 nm2, (b and q): VS = −1.6 V, It = 30 pA, c = 1 × 10⁻⁶ M; unit cell: a = b = (8.2 ± 0.2) nm, γ(a,b) = (60 ± 2)°, additional packing parameters: γ(a,cA) = (16 ± 3)°, γ(b,d1) = (18 ± 3)°, D3 = 1.5 nm; (c), (g), (l), (m), (r) 2a (c): 25.5 × 25.5 nm2, VS = −1.1 V, It = 11 pA, c = 1 × 10⁻⁶ M; (r): 10.5 × 10.5 nm2, VS = −1.6 V, It = 20 pA, c = 10−6 M; unit cell: a = (9.3 ± 0.2) nm, b = (5.7 ± 0.2) nm, γ(a,b) = (88 ± 2)°, additional packing parameters: acA, γ(a,d1) = (12 ± 2)°, C–C distance of carboxylate groups: D4 = 2.3 nm; (d), (h), (n), (o), (s)–(u) 2b (d): 37.2 × 37.2 nm2, VS = −0.9 V, It = 22 pA, c = 1 × 10⁻⁶ M; s: 10.0 × 16.9 nm2, VS = −0.8 V, It = 15 pA, c = 1 × 10⁻⁶ M; unit vector (neglecting different backbone orientations): a = (4.4 ± 0.2) nm, additional packing parameters: acA, γ(a,d1) = (90 ± 2)°, C–C distance of carboxylate groups: D5 = 2.4 nm. Side chains that are not adsorbed along the HOPG substrate but point towards the solution phase are not shown in the models. The red and solid white (black) lines indicate the unit cells (a, b) and HOPG main-axis directions (d1, d2, d3), respectively, the dashed black (white) lines in (c), (g), (r) indicate the HOPG armchair direction (d4) along which the four hexadecyloxy side chains per two molecules of 2a are oriented. Bright and dark blue and grey colors of the models indicate molecules having different backbone orientations (cA, cA, cB, cB).

Fig. 2