
Box 1 Figure:
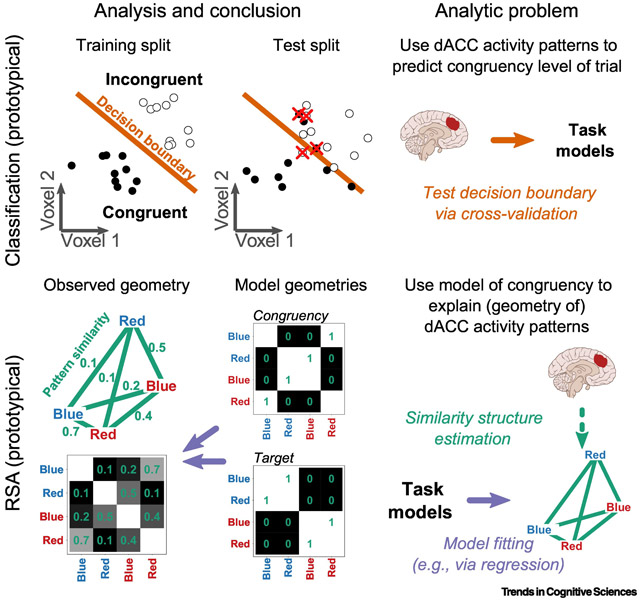
Illustration of prototypical classification and RSA approaches, using a toy example of a four-stimuli color-word Stroop experiment. Classification, Analysis and Conclusion, Trial-level activity patterns from a 2-voxel brain region (dACC) are depicted as points in 2-dimensional space. Classification corresponds to fitting a decision boundary (orange) that separates patterns along a single factor (e.g., congruency; hollow or filled points) and is typically assessed via cross-validation (training and test splits). Classification, Analytic Problem, Classification directly uses brain activity patterns to predict the task model (congruency). RSA, Analysis and Conclusion, Condition-average dACC activity patterns (observed geometry) are depicted as a spatial arrangement (or geometry) of four points (here, the color-word stimuli), with six inter-point distances (green lines). The smaller the distance between patterns, the more similar they are (green numbers). The observed geometry can also be represented as a similarity matrix, as can model geometries. RSA, Analytic Problem, In RSA, brain activity patterns are first transformed into geometries, which are then explained by task models (target, congruency).