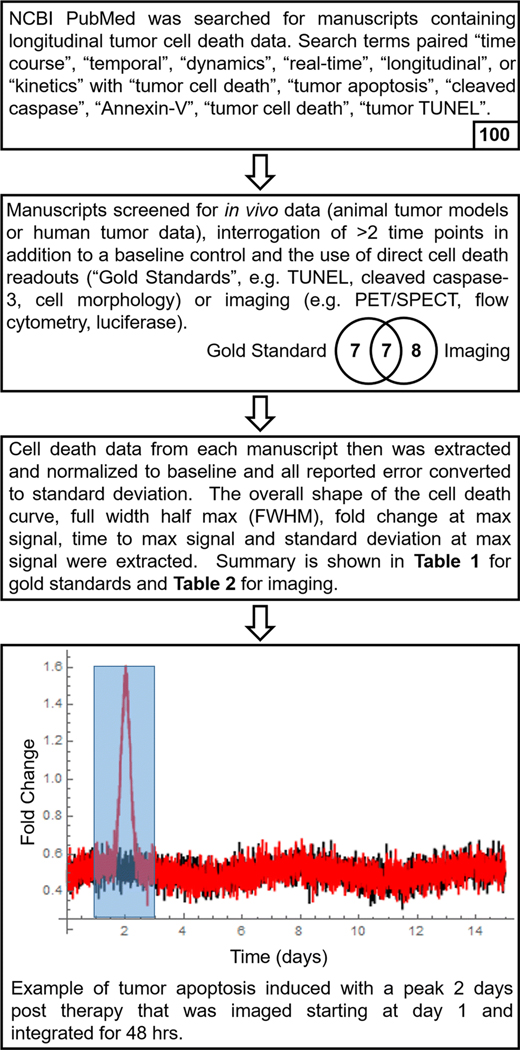
Figure 1: Extraction of Tumor Apoptosis Time Course Data from the Literature.
The tumor apoptosis literature was surveyed and filtered according to the criteria described in the top two boxes to obtain time-series data relating the amplitude of tumor apoptosis to the time post-treatment. The number at the bottom of each box indicates the number of manuscripts that met the stated criteria. The resulting time series data (Table 1) were used to construct a mathematical model of tumor apoptosis (red line) and background apoptosis (black line). This model was computationally integrated (e.g. shaded blue box) to obtain theoretical contrast ratios.

