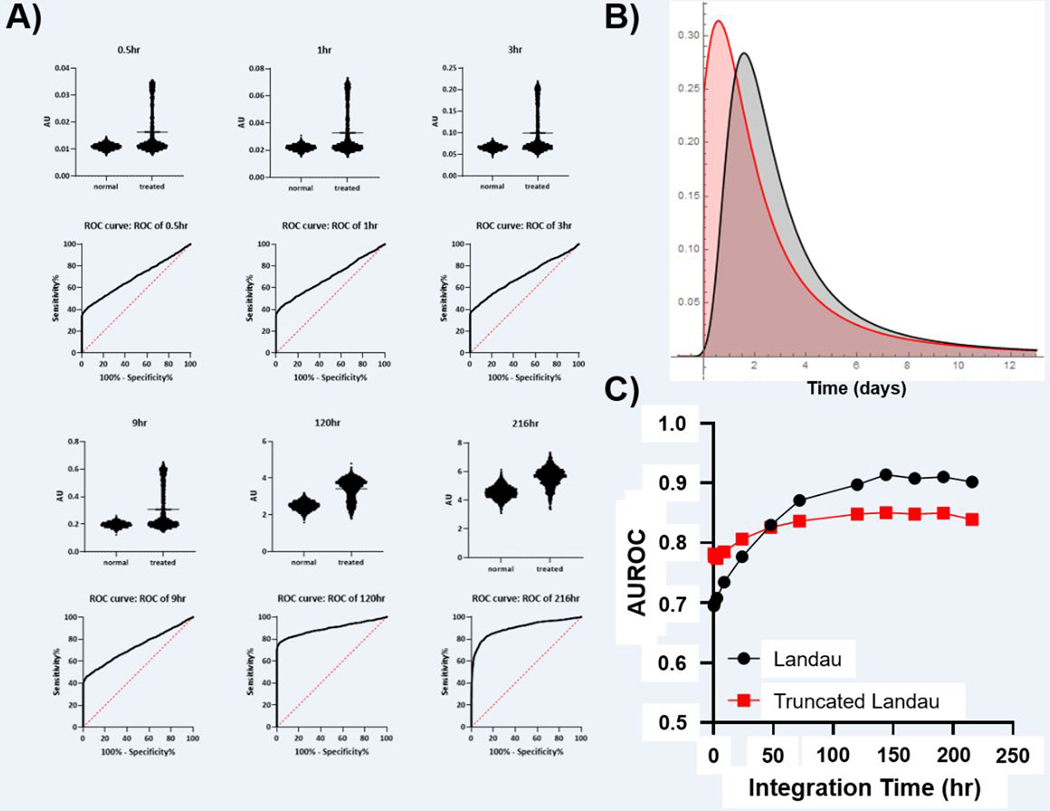
Figure 4: Simulation of Tumor Cell Death with Landau and Truncated Landau Distributions of Apoptosis Initiation Time.
A) Simulated signal (AU) obtained with the imaging integration time shown at the top of each graph. The calculated ROC for each imaging integration time is shown below. B) The distribution of apoptosis induction times utilized in the experiments (red = truncated Landau, black = Landau. C) The relationship between integration time and AUROC for both Landau models of apoptosis start time (SEM is below the size of data points).

