
Figure 1.
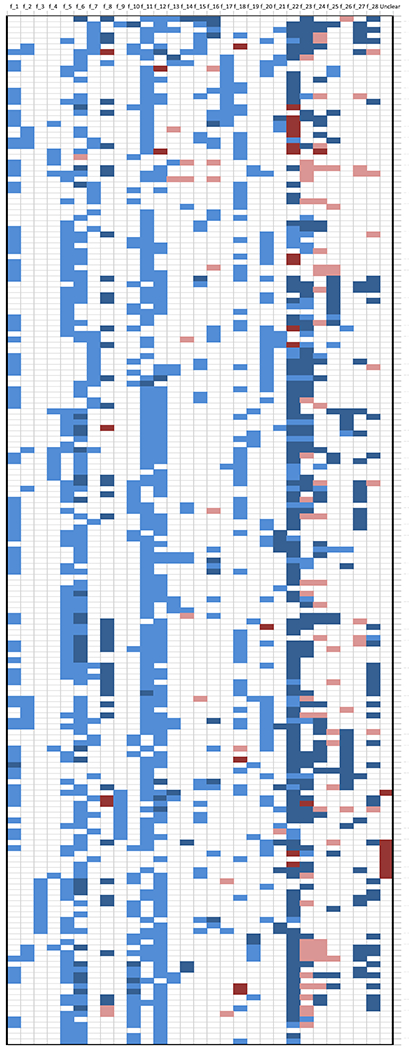
Summary across the 186 reviewed articles of the methods used to conclude if a variant or gene was plausibly involved in a causal pathway to cancer. The y-axis displays the PMID of the 186 coded papers; the x-axis displays 29 broad categories of filtering criteria described in Table 1. White color indicates that the criterion was not used by the authors to identify a variant/gene as possibly linked to the cancer under investigation. Light blue indicates that the criterion was used as a selection filter. Dark blue indicates that the criterion was used as increased evidence of variant/gene-cancer association. Pink color indicates that the criterion was used as decreased evidence of variant/gene-cancer association. Dark red indicates that the information related to that criterion was unclear. The last category on the right “unclear” indicates that some other not clearly stated criteria were used. The order of the papers along the y-axis is based on a computed correlation between values 2 (for supporting evidence), 1 (for used selection criteria), 0 (for not used criteria), −1 (for unsupporting evidence) and −2 (for unclear), i.e., papers using similar filtering criteria sets are shown next to each other.