
Figure 2.
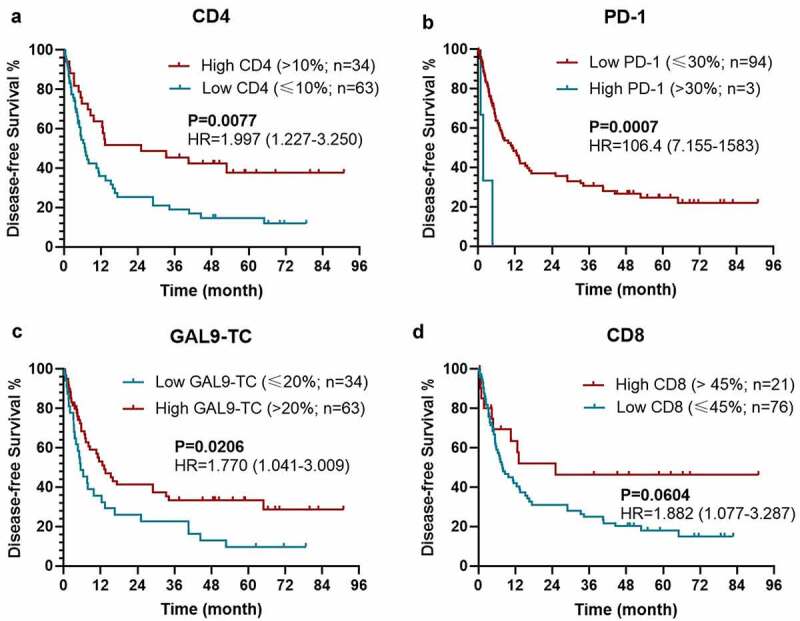
Kaplan–Meier survival curves with log-rank tests for DFS between patients with different levels of CD4 (a), PD-1 (b), Gal-9 on TC (c), and CD8 (d)
Abbreviations: DFS, disease-free survival; HR, hazard ratio; TC, tumor cell; CD4, cluster of differentiation 4; CD8, cluster of differentiation 8; PD-1, programmed death-1; Gal-9, galectin-9.