
Figure 8.
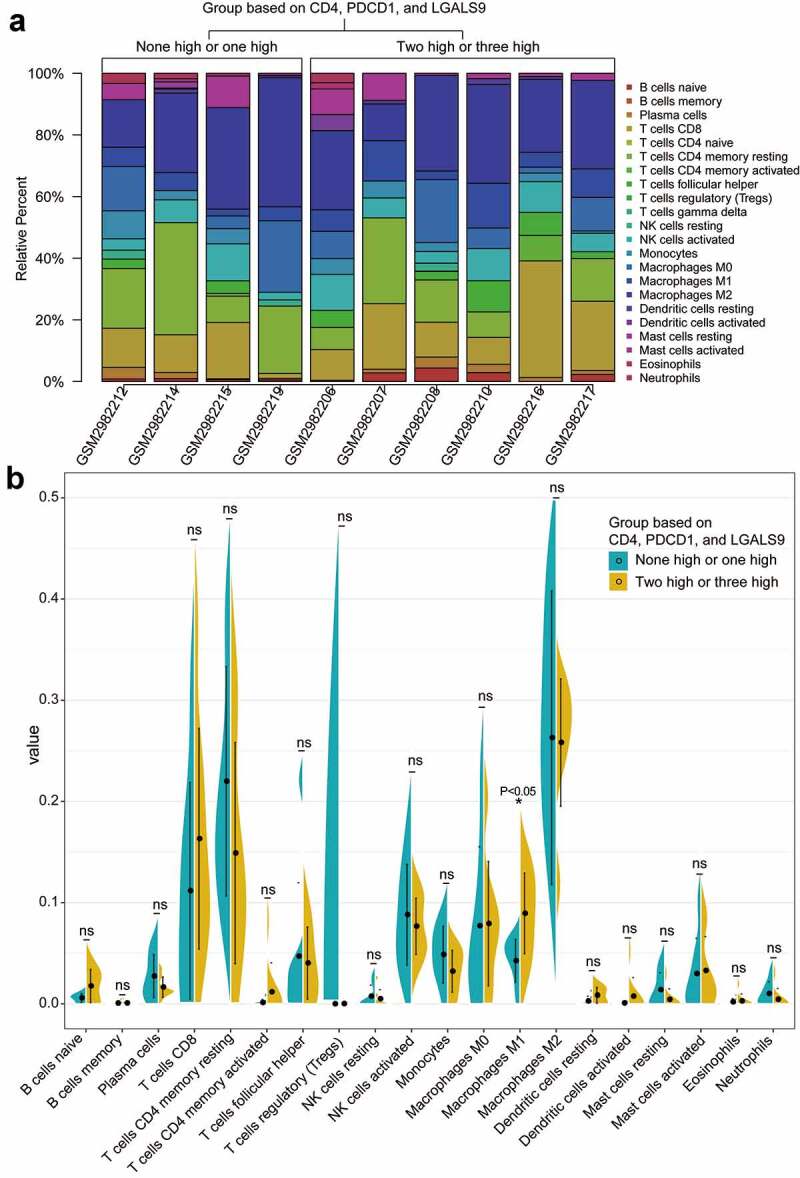
The landscapes of immune infiltration of the two groups with the low and high expression of CD4, PDCD1, LGALS9. (a) The stacked histogram of the proportion of 22 types of cells in ten PSC tissues with a P value<0.05 according to CIBERSORT. (b) The comparison of the percentage of each cell between the two groups in all samples. The black dots in the violins represent the mean of the group, and the vertical lines represent the standard of error (SE). *P < 0.05; ns, not significant
Abbreviations: PSC, pulmonary sarcomatoid carcinoma.