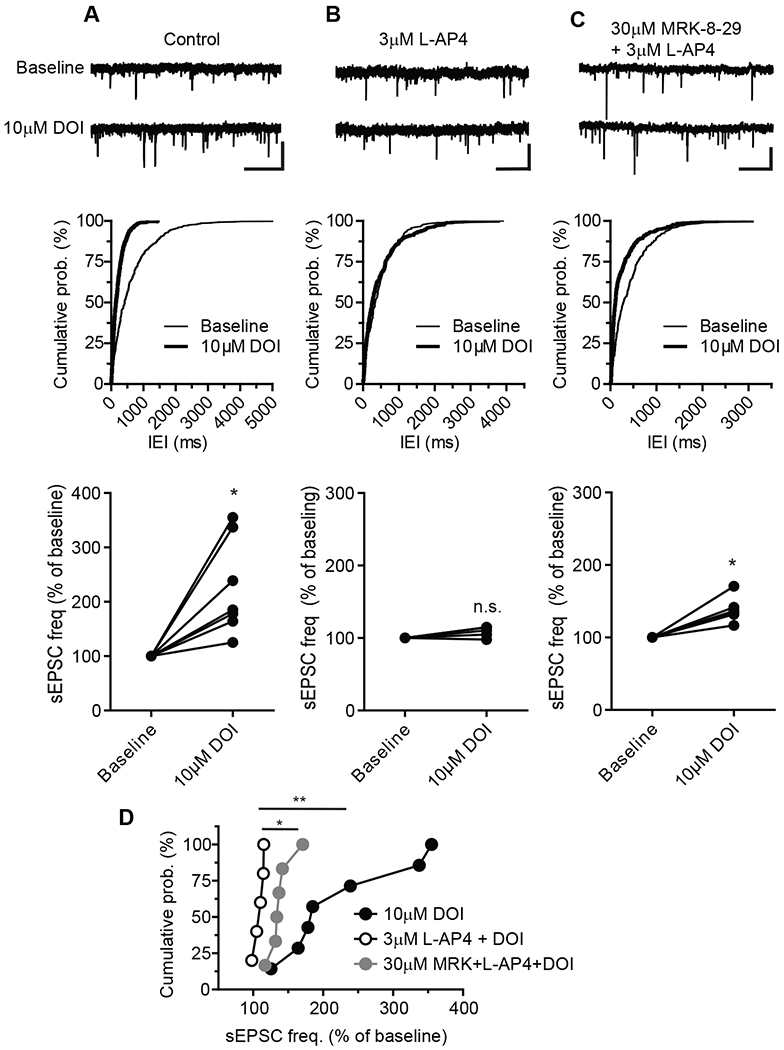
Fig. 4. Effects of L-AP4 and MRK-8-29 on 5-HT2 agonist DOI induced increase in sEPSCs in mPFC layer V pyramidal cells.

(A to C) Sample traces (top), cumulative probability plots of inter-event interval (IEI) of sEPSCs (middle) from three representative cells and summary plot of normalized group data (bottom) before and during application of 10μM DOI (A), before and during application of 10μM DOI in the presence of 3 μM L-AP4, and before and during application of 10μM DOI in the presence of 30 μM MRK-8-29 and 3 μM L-AP4. Calibration bars for sEPSC traces: 20pA/1s (A and B), and 30pA/1s (C). Normalized sEPSC frequency after application of 10μM DOI verse baseline under different conditions were compared using Wilcoxon matched-pairs tests: *P < 0.05, N = 7 neurons from 5 mice (A, bottom); P > 0.1, N = 5 per 4 (B, bottom); *P < 0.05, N = 6 per 4 (C, bottom). (D) Cumulative probability plots summarizing DOI-induced sEPSC frequency change in control, in the presence of L-AP4 and in the combination of L-AP4 and MRK-8-29. * P < 0.05 and ** P < 0.01 by one-way ANOVA [F(2,15)=7.113, P = 0.0067] with Bonferroni’s post-test.
