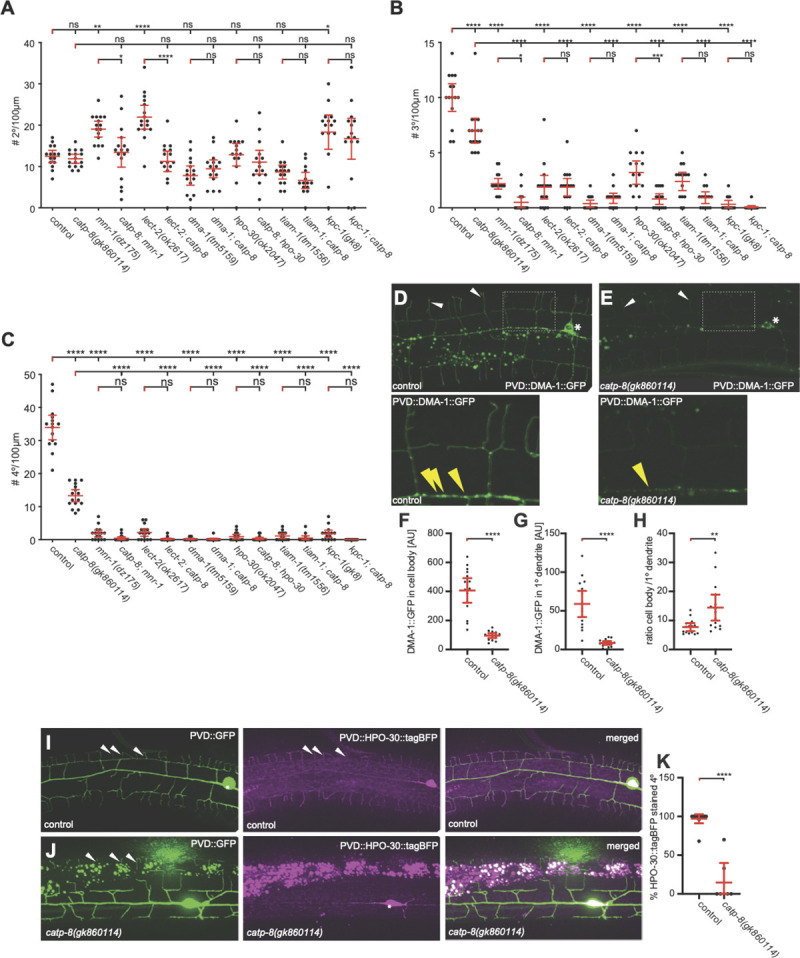
Fig 6. The catp-8/P5A ATPase functions with the Menorin pathway during dendrite patterning.

A.—C. Quantification of the number of secondary (A), tertiary (B), and quaternary (C) dendrite branches within 100 μm anterior to the PVD cell body in animals of the indicated genotypes. Note that all alleles are molecular or genetic null alleles. Data are represented as the mean ± 95% confidence interval. * P<0.05, ** P<0.01, *** P<0.001, **** P < 0.0001 ns not significant; one-sided ANOVA with Tukey’s multiple comparison test. n = 15 animals per genotype. D.—E. Maximum z-projection of confocal images and magnified inset of DMA-1::GFP expressed in PVD (qyIs369) in a wildtype or catp-8 mutant background, showing a reduction of DMA-1::GFP puncta in the primary dendrite (yellow arrowheads) in mutant animals. Note also the reduction in overall fluorescence in catp-8 mutant animals. F.—H. Quantification of DMA-1::GFP signal in cell body (F), and on the primary dendrite 100 μm anterior from the cell body (G) in control and catp-8 animals. The signal ratio of cell body to primary dendrite is presented in (H). Data are represented as the mean ± 95% confidence interval. ** P<0.01, **** P<0.0001, Mann-Whitney test. n = 14 animals per genotype. I.—J. Maximum z-projection of apotome images of HPO-30::tagBFP (magenta) expressed in PVD and PVD reporter wdIs52 (green) in control (I) or catp-8 mutant animals (J). Note, that as previously reported [40], overexpression of HPO-30::tagBFP in PVD dendrites results in a reduced number of quaternary dendrites, possibly due to downregulation of DMA-1/LRR-TM. K. Percentage of HPO-30::tagBFP stained quaternary dendrites 100 μm anterior to the cell body in control or catp-8 mutant animals, presented as mean ± 95% confidence interval. **** P<0.0001, Mann-Whitney test. n = 10 animals per genotype.
