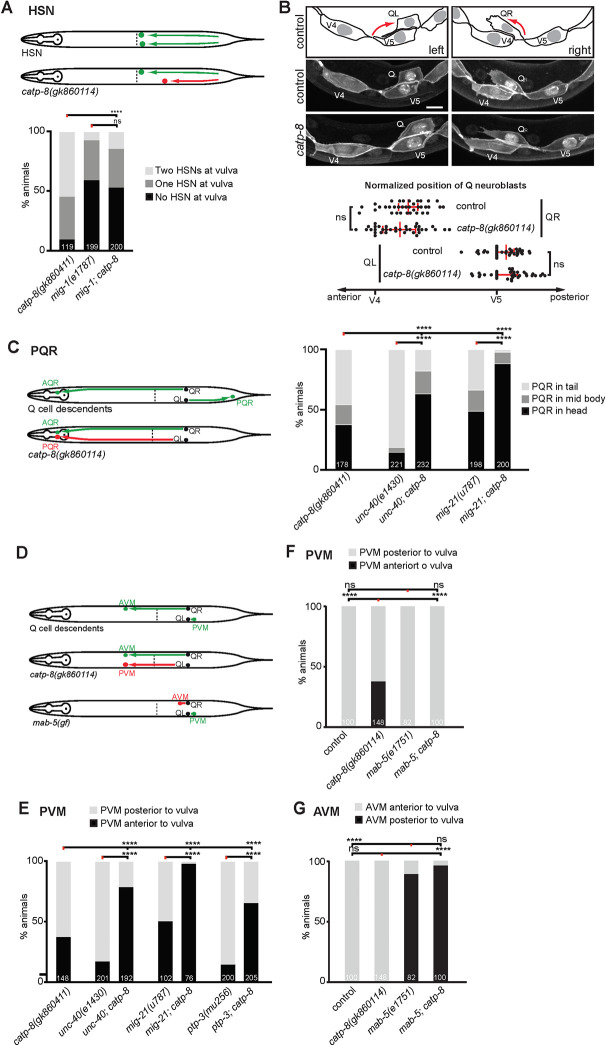
Fig 7. Genetic interactions of catp-8/P5A ATPase during cell migrations.
A. Schematics depicting normal HSN migration (upper panel) and HSN migration defects (lower panel), and quantification of HSN migration defects in the genotypes indicated. Percent animals are shown with neurons in the wild type position (light grey bars), partially incomplete migration (dark grey bars) and completely failed migration (black bars). Pairwise statistical significance was calculated using Chi-squared test or Fisher exact test. **** P ≤ 0.0001, ns not significant. Sample size indicated on graph. B. Schematic, images and quantification of the relative position of initial Q neuroblast migration in the genotypes indicated, imaged 4.5 hours after hatching. Scale bar = 5 μm. Data are represented as the mean ± 95% confidence interval. ns not significant; Mann-Whitney test. n = 35 animals per genotype. C. Schematics depicting normal PQR migration (upper panel) and migration defects (lower panel), and quantification of PQR migration defects in the genotypes indicated. Percent animals are shown with neurons in the wild type position (light grey bars), partially incomplete migration (dark grey bars) and completely failed migration (black bars). Pairwise statistical significance was calculated using Chi-squared test or Fisher exact test. **** P ≤ 0.0001. Sample size indicated on graph. D. Schematics depicting normal AVM and PVM migration (upper panel) and migration defects (middle and lover panels) in the genotypes indicated. E. Quantification of PVM migration defects in the genotypes indicated. Percent animals are shown with neurons in the wild type position (light grey bars), and failed migration (black bars). Pairwise statistical significance was calculated using Chi-squared test or Fisher exact test. **** P ≤ 0.0001. Sample size indicated on graph. F.–G. Quantification of PVM (F) and AVM (G) migration defects in the genotypes indicated. Percent animals are shown with neurons in the wild type position (light grey bars), and failed migration (black bars). Pairwise statistical significance was calculated using Chi-squared test or Fisher exact test. **** P ≤ 0.0001, ns not significant. Sample size indicated on graph.

