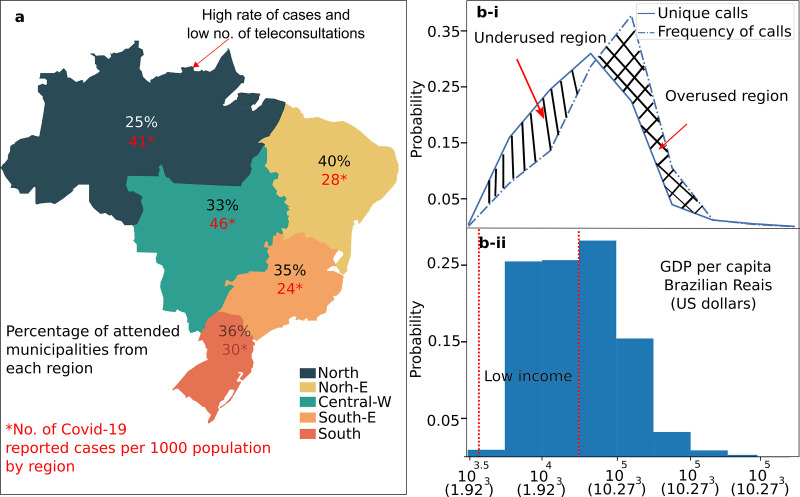
Fig 2. The proportion of municipalities attended by TRS in Brazil by region.
(a) The Northern region has a high rate of confirmed cases (41) but a low number of teleconsultations (25%). (b) The percentage of attended municipalities according to its GDP per capita. The straight line represents the frequency of calls by GDP (unique calls), while the dashed line is the frequency of municipalities taking all calls into consideration. High-income municipalities perform more COVID-19 teleconsultations than low-income municipalities, the differences denote overused and sub used regions.

