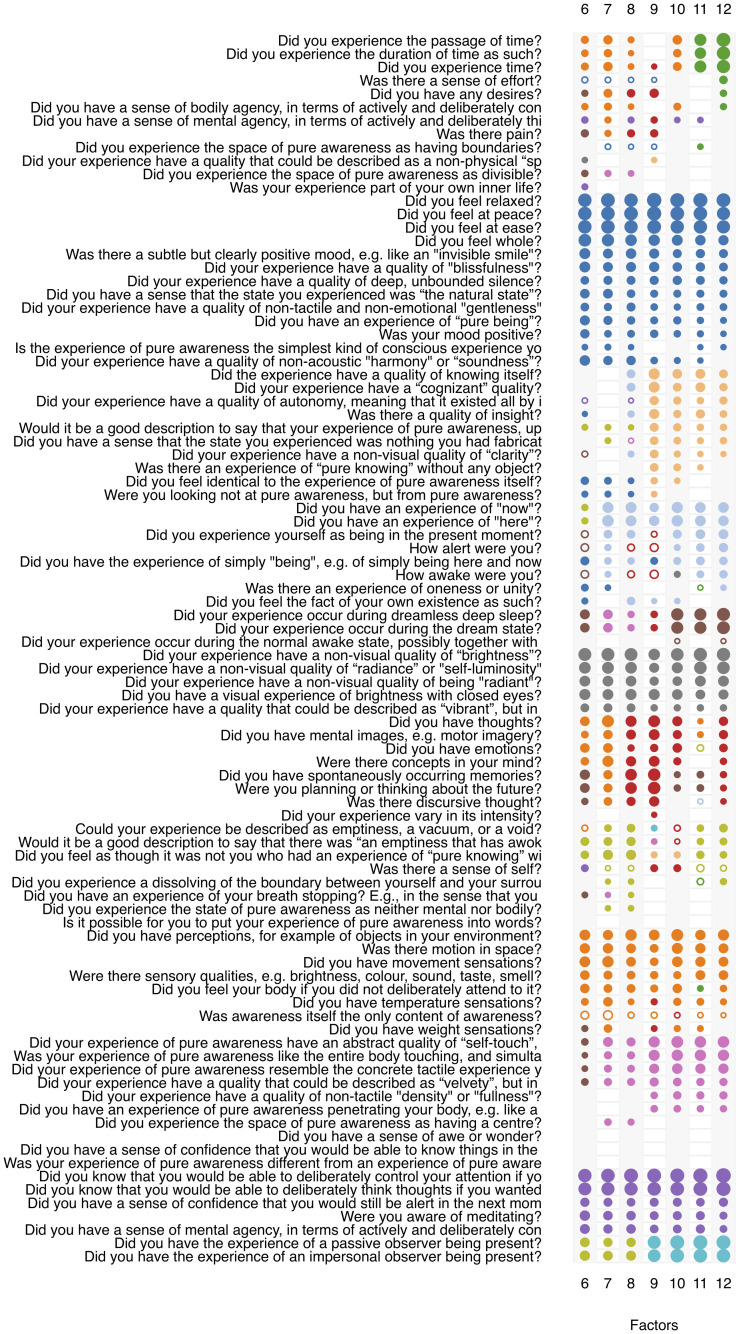
Fig 4. Results of exploratory factor analysis of the MPE-92M questionnaire (N = 1393).
Questionnaire items are listed on the y-axis. Each column corresponds to a full factor solution with the number of extracted factors given on the x-axis. The size (area) of the circles is proportional to the factor loadings. Open circles indicate negative loadings, and loadings below 0.3 are not shown. Color represents factor membership. An attempt was made to identify the "same" factors across all factor solutions and color them identically. “Sameness” here is not objectively definable, but the degree of similarity was operationalized as membership in the same cluster following hierarchical cluster analysis. Items are sorted by factor membership and size of factor loading in the 12-factor solution, as it was this solution that was finally chosen as optimal.

