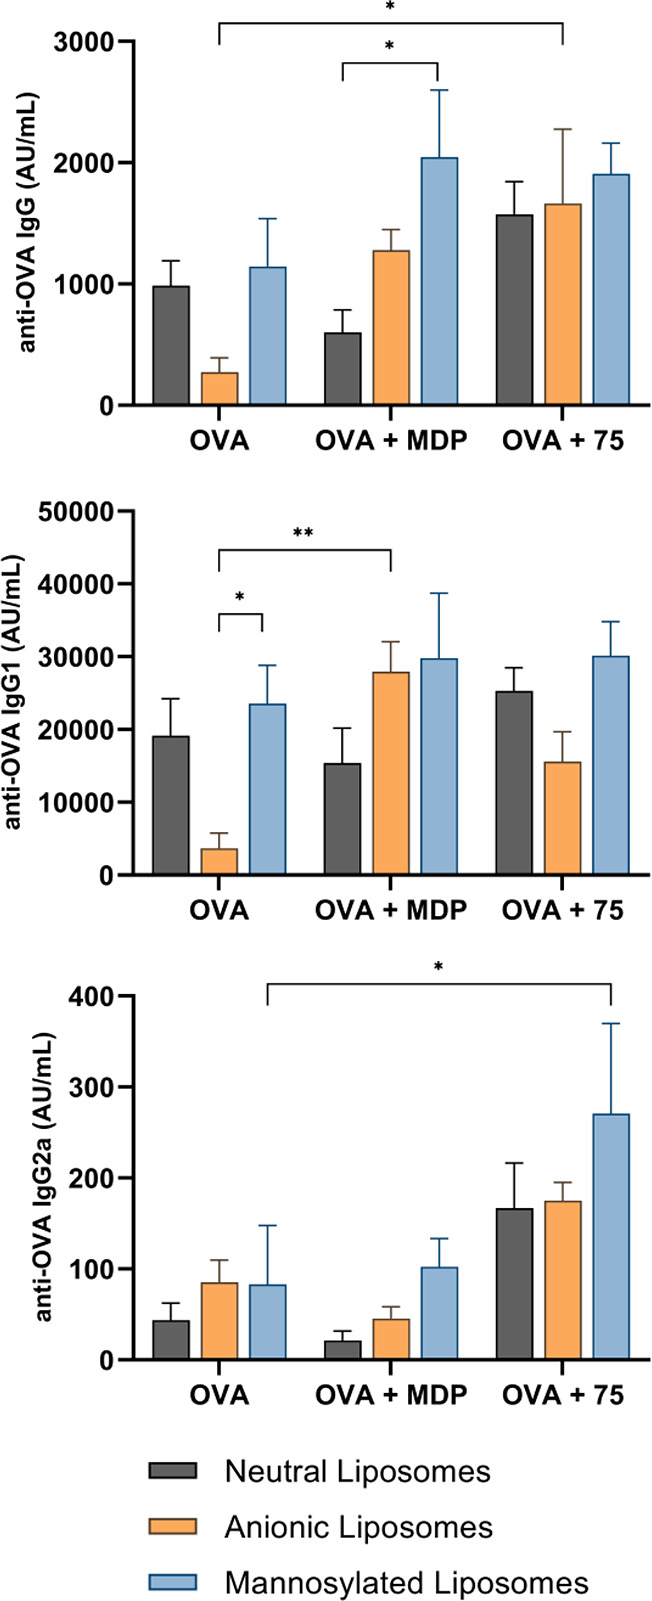
Figure 11.

Ovalbumin-specific IgG (top), IgG1 (middle), and IgG2a (bottom) responses in NIH/OlaHsd mice after immunization with neutral (phosphatidylcholine–cholesterol, 7:5), anionic (phosphatidylcholine–cholesterol–dicetylphosphate, 7:5:1), and mannosylated (phosphatidylcholine–cholesterol–mannose-PEG-PA, 7:5:0.5) ovalbumin-loaded liposomes (10 μg of ovalbumin per dose), with adjuvants MDP or 75 (0.15 μmol of adjuvant per dose). The concentrations were measured 1 week after the second booster dose. Data are expressed as mean ± SEM of 5 mice per group. *p < 0.05, **p < 0.01.
