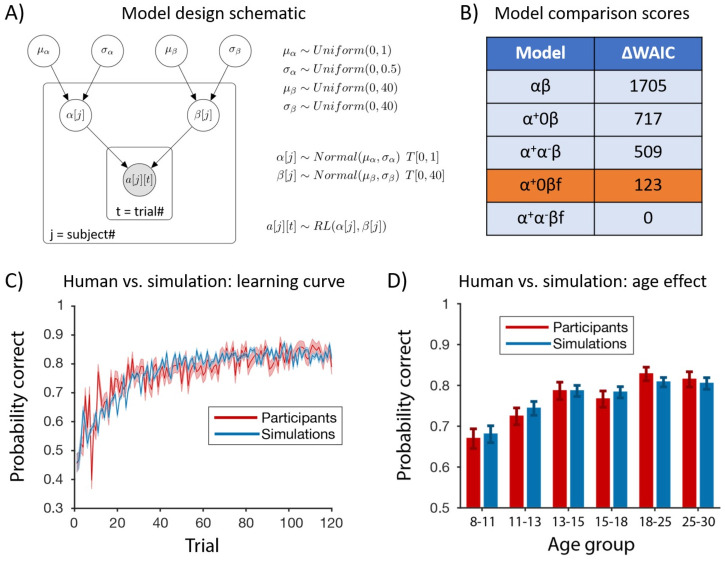
Fig 2. Hierarchical Bayesian modeling and model comparison.
(A) We illustrate the hierarchical model design with the αβ model as an example, We assumed that parameters of individual participants came from the same group level distribution, which is truncated normal parametrized by the group-level mean and standard deviation (μα and σα for α; μβ and σβ for β). The group-level mean and standard deviation followed weakly informative priors (uniform and bounded). The parameters for each individual participant are used in the likelihood of each action on every trial based on the αβ model. T[m, n] indicates truncation of distribution (e.g. the learning rate, α, is bounded by [0, 1]). The filled circle represented observed variable (in this case, participants’ choices on each trial); unfilled circles represented latent variables (in this case, group and individual model parameters). (B) We calculated WAIC for model comparison. ΔWAIC represents the difference between the WAIC of the considered model and the model with the lowest (i.e. best) WAIC. While the α+α−βf model had the lowest WAIC score, the α− parameter was not recoverable and showed signs of overfitting (see S1 Text: Model comparison extended). We thus focus on the α+0βf model. (C-D) We used fitted parameters from the α+0βf model to generate simulated trajectories. The simulated performance captures the average learning curve throughout the experiment (C), and replicates the age effect (D).

