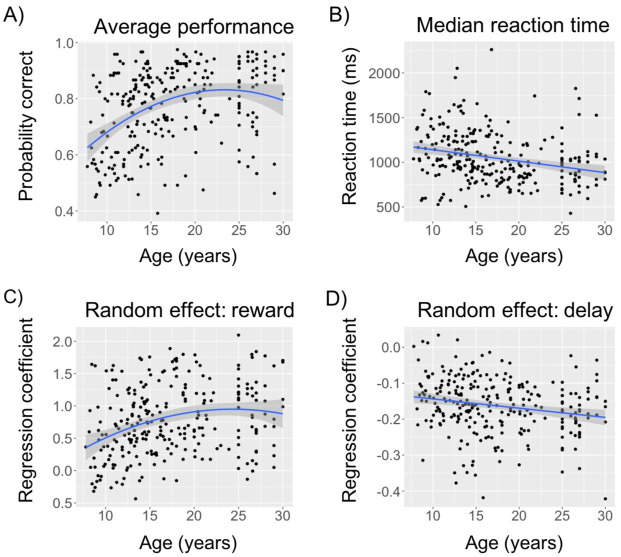
Fig 3. Age effects on participants’ behavior.
Scatter plot of age (x-axis) and (A) probability of choosing the correct response, (B) median reaction time, (C) random effect for reward history, and (D) random effect of delay. Each black dot represents one participant. The blue curve represents linear/quadratic regression line. There was no effect of sex in any analysis. Shaded region represents 95% confidence interval.

