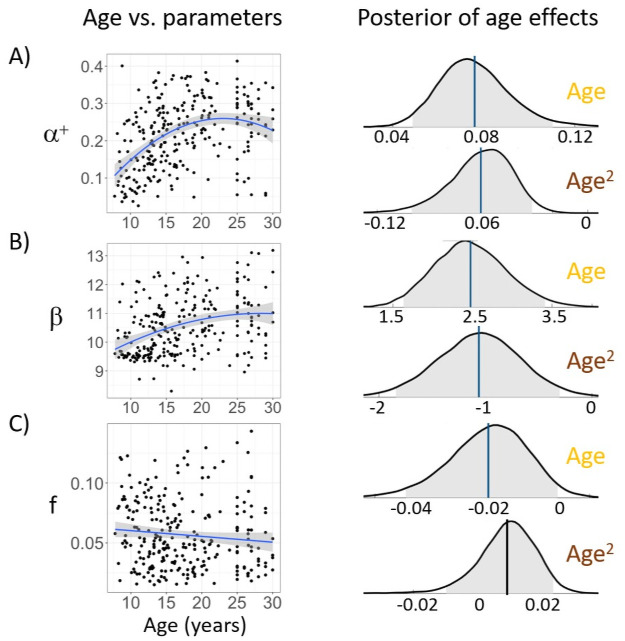
Fig 4. Age effects on model parameters.
We directly incorporated age-related parameters into MCMC sampling to test within the hierarchical Bayesian modeling framework whether age had a linear or quadratic effect on all three model parameters: α+ (A), β (B), f (C). Left panel: individual parameters from the original α+0βf model plotted against age. For visualization, we included a regression line; the shaded region indicates 95% CI. Right: distribution of posterior samples for linear (top, yellow) and quadratic (bottom, brown) regression coefficients. The vertical line represents the mean of all samples, with blue indicating an effect being present (i.e., 95% CI not including 0), and black indicating no effect. Shaded region shows 95% confidence interval.

