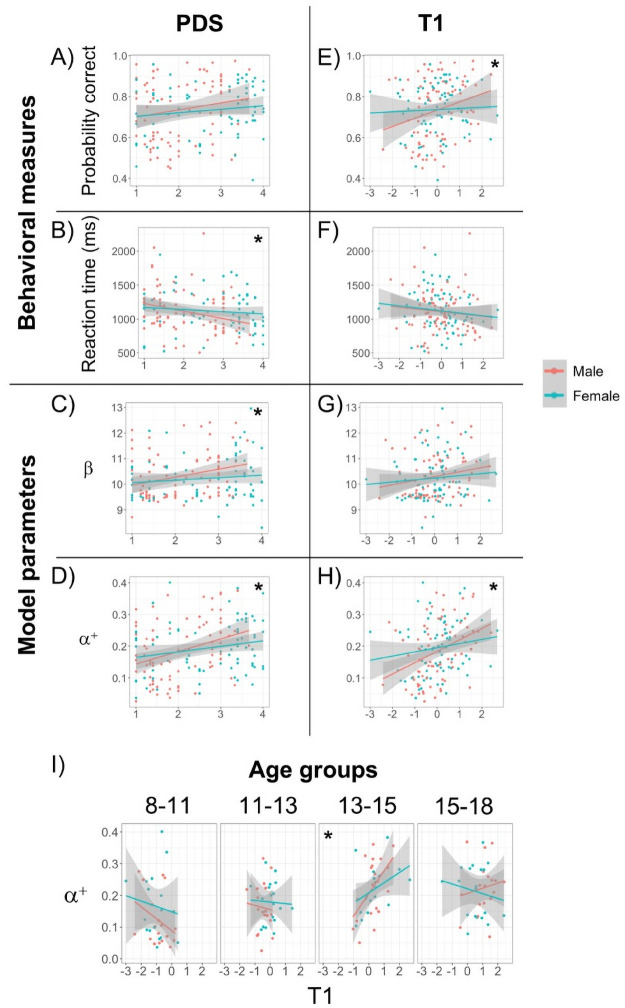
Fig 5. Pubertal effects on behavioral measures and model parameters.
Scatter plots of (A) Puberty development scale (PDS) vs. overall performance, (B) PDS vs. median reaction time, (C) PDS vs. α+, and (D) PDS vs. β. (E-H) Same as (A-D) but with z-scored testosterone level (T1). (I) Scatter plot of T1 vs. α+ in each of the four age groups younger than age 18. Each colored dot represents one participant under 18. Color indicates self-reported sex. There were no significant effects of sex or interactions. The lines represent best fitting linear regression lines. Shaded region represents 95% confidence interval. * indicates a significant main effect of PDS or T1 (see main text).

